JavaScript/jQuery Chart - argumentAxis.tick
Configures the appearance of major axis ticks.
Type:
Ticks divide an axis into sections that measure off values on this axis.
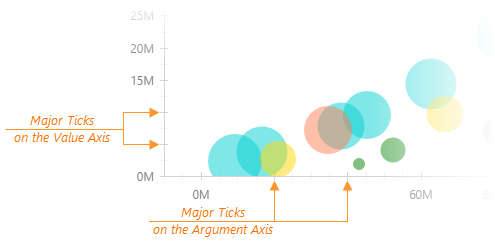
The commonAxisSettings.tick object specifies common settings for all major ticks in the chart. To configure only those major ticks that belong to a particular axis, use the following objects.
Axis-specific settings override common settings.
See Also
- argumentAxis.tickInterval - specifies the tick interval of the argument axis.
- valueAxis.tickInterval - specifies the tick interval of the value axis.
- commonAxisSettings.minorTick - customizes the appearance of minor ticks.
color
Specifies the color of ticks.
Type:
Default Value: '#d3d3d3'
This option supports the following colors:
- Hexadecimal colors
- RGB colors
- RGBA colors
- Predefined/cross-browser color names
- Predefined SVG colors

 Select one or more answers