All docs
V19.1
24.1
The page you are viewing does not exist in version 24.1.
23.2
The page you are viewing does not exist in version 23.2.
23.1
The page you are viewing does not exist in version 23.1.
22.2
The page you are viewing does not exist in version 22.2.
22.1
The page you are viewing does not exist in version 22.1.
21.2
The page you are viewing does not exist in version 21.2.
21.1
The page you are viewing does not exist in version 21.1.
20.2
The page you are viewing does not exist in version 20.2.
20.1
The page you are viewing does not exist in version 20.1.
19.2
19.1
18.2
18.1
17.2
Box
Map
Vue
A newer version of this page is available. Switch to the current version.

jQuery Chart - valueAxis.constantLines.label

Configures the constant line label.

Type:

Object

The constant line label displays the value of the constant line.

DevExtreme HTML5 Charts ConstantLine ConstantLineLabel

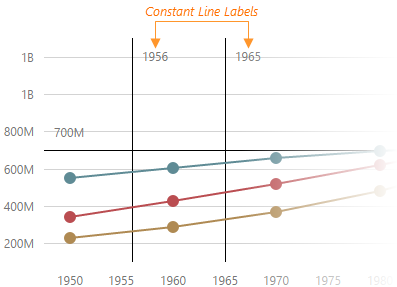
The label object specifies the following characteristics of the constant line label.

  • Visibility
    By default, the constant line label is visible. To hide it, assign false to the visible option.
  • Text
    By default, the constant line label displays the value of the constant line. To assign a custom text to the constant line label, use the text option.
  • Position
    The constant line label can be located inside or outside the chart plot. Use the position option to change this setting.
  • Alignment
    To align the constant line label in the horizontal and vertical directions, use the horizontalAlignment and verticalAlignment options.
  • Font
    To change the font of the constant line label, use the fields of the font object.
See Also
  • valueAxis.constantLineStyle.label - specifies a unified style for the labels of those constant lines that belong to the value axis.
  • commonAxisSettings.constantLineStyle.label - specifies a unified style for the labels of all constant lines in the widget.

font

Specifies font options for constant line labels.

Type:

Object

horizontalAlignment

Aligns constant line labels in the horizontal direction.

Type:

String

Default Value: 'left'
Accepted Values: 'center' | 'left' | 'right'

When using a widget as an ASP.NET MVC 5 Control or a DevExtreme-Based ASP.NET Core Control, specify this option using the HorizontalAlignment enum. This enum accepts the following values: Left, Center and Right.

position

Specifies the position of constant line labels on the chart plot.

Type:

String

Default Value: 'inside'
Accepted Values: 'inside' | 'outside'

By default, constant line labels are displayed inside the chart plot near the constant lines they belong to. To place the labels outside the chart plot, set the position option to "outside".

Use the RelativePosition enum to specify this option when the widget is used as an ASP.NET MVC 5 Control or a DevExtreme-Based ASP.NET Core Control. This enum accepts the following values: Inside and Outside.

text

Specifies the text of a constant line label. By default, equals to the value of the constant line.

Type:

String

Default Value: undefined

verticalAlignment

Aligns constant line labels in the vertical direction.

Type:

String

Default Value: 'top'
Accepted Values: 'bottom' | 'center' | 'top'

Use the VerticalAlignment enum to specify this option when the widget is used as an ASP.NET MVC 5 Control or a DevExtreme-Based ASP.NET Core Control. This enum accepts the following values: Top, Center, and Bottom.

visible

Makes constant line labels visible.

Type:

Boolean

Default Value: true