jQuery Chart - StepAreaSeries.hoverStyle.hatching
Type:
direction
The following values are available:
- none
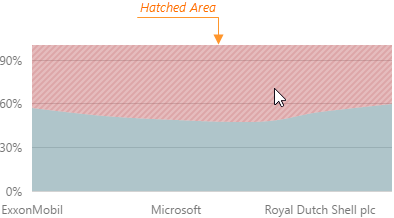
Does not apply hatching. - right
Draws diagonal hatching lines upwards from left to right. - left
Draws diagonal hatching lines downwards from left to right.
Use the HatchingDirection enum to specify this option when the widget is used as an ASP.NET MVC 5 Control or a DevExtreme-Based ASP.NET Core Control. This enum accepts the following values: Right, Left, and None.
Feedback