DevExtreme jQuery - Bar Series
Bar series visualize data as a collection of bars. Those bars can be displayed side by side, as in the Bar series type, or can be put in stacks, as in the Stacked Bar and Full-Stacked Bar series types.
To specify one or another series type, assign its name to the series[].type option. You can configure:
- Each series individually using the series array;
- All series in the Chart using the commonSeriesSettings object;
- All series of a specific type using objects nested in commonSeriesSettings: bar, stackedbar, and fullstackedbar.
jQuery
$(function () {
    $("#chartContainer").dxChart({
        series: [{
            type: "bar"
        }, {
            // ...
        }],
        commonSeriesSettings: {
            bar: { ... },
            stackedbar: { ... },
            fullstackedbar: { ... }
        }
    });
});
Angular
<dx-chart ... >
    <dxi-series type="bar"></dxi-series>
    <dxi-series ... ></dxi-series>
    ...
    <dxo-common-series-settings>
        <dxo-bar ... ></dxo-bar>
        <dxo-stackedbar ... ></dxo-stackedbar>
        <dxo-fullstackedbar ... ></dxo-fullstackedbar>
    </dxo-common-series-settings>
</dx-chart>
import { DxChartModule } from "devextreme-angular";
// ...
export class AppComponent {
    // ...
}
@NgModule({
    imports: [
        // ...
        DxChartModule
    ],
    // ...
})
Refer to the BarSeries, StackedBarSeries, or FullStackedBarSeries section of the API Reference for a full list of options available to a specific series type. Most these options are self-explanatory, yet several of them are worth special mention.
- minBarSize
Specifies the minimum height of bars in a series; allows you to keep bars big enough for user interaction. - stack (for stacked series)
Allows you to distribute bars of a single argument between several side-by-side stacks.
See Also
Specify the Bar Width
You can specify individual series' bar width. In multi-series charts, different series' bars with the same argument are collected in groups with a customizable width. You can use fixed (that is, pixels) or relative units to set both these widths. Use relative units if the width should adapt to the widget or container size. Fixed width takes precedence over relative width if both are specified.
Relative Bar Width
Regulating the empty space on a bar's sides controls the relative bar width. Use the barPadding option to specify how much of the available sector should be empty. For example, a barPadding of 0.1 leaves 10% of the available space empty giving the rest to the bar.
jQuery
$(function () {
    $("#chartContainer").dxChart({
        series: [{
            // ...
            barPadding: 0.1 // for an individual series
        }, {
            // ...
        }],
        commonSeriesSettings: {
            // ...
            barPadding: 0.1 // for all series in the chart
        }
    });
});
Angular
<dx-chart ... >
    <dxi-series
        [barPadding]="0.1"> <!-- for an individual series -->
    </dxi-series>
    <dxi-series ... ></dxi-series>
    ...
    <dxo-common-series-settings
        [barPadding]="0.1"> <!-- for all series in the chart -->
    </dxo-common-series-settings>
</dx-chart>
import { DxChartModule } from "devextreme-angular";
// ...
export class AppComponent {
    // ...
}
@NgModule({
    imports: [
        // ...
        DxChartModule
    ],
    // ...
})
In single-series charts, the available space equals the interval between two major ticks. In multi-series charts, it depends on the number of bars in the parent group and the group's width.
The parent group's width can be specified using the barGroupPadding option. It works like barPadding, dividing the available space between the bar group and an empty space. For example, a barGroupPadding of 0.2 leaves 20% of the available space empty. The available space is the interval between two major ticks. Unlike barPadding, which can be specified for each series individually, barGroupPadding applies to the whole chart.
jQuery
$(function () {
    $("#chartContainer").dxChart({
        // ...
        barGroupPadding: 0.2
    });
});
Angular
<dx-chart ...
    [barGroupPadding]="0.2">
    <!-- ... -->
</dx-chart>
import { DxChartModule } from "devextreme-angular";
// ...
export class AppComponent {
// ...
}
@NgModule({
imports: [
// ...
DxChartModule
],
// ...
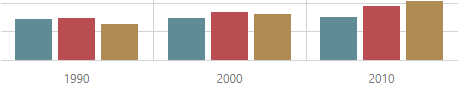
})The following images illustrate how different barPadding and barGroupPadding values change a chart's appearance. In this example, all series have the same barPadding.
| Settings | Result |
|---|---|
| barGroupPadding: 0 barPadding: 0 |
 |
| barGroupPadding: 0.2 barPadding: 0 |
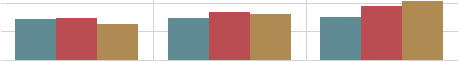 |
| barGroupPadding: 0.2 barPadding: 0.1 |
 |
Fixed Bar Width
The barWidth option specifies fixed bar width in pixels. This option is available for each series.
jQuery
$(function () {
    $("#chartContainer").dxChart({
        series: [{
            // ...
            barWidth: 50 // for an individual series
        }, {
            // ...
        }],
        commonSeriesSettings: {
            // ...
            barWidth: 50 // for all series in the chart
        }
    });
});
Angular
<dx-chart ... >
    <dxi-series
        [barWidth]="50"> <!-- for an individual series -->
    </dxi-series>
    <dxi-series ... ></dxi-series>
    ...
    <dxo-common-series-settings
        [barWidth]="50"> <!-- for all series in the chart -->
    </dxo-common-series-settings>
</dx-chart>
import { DxChartModule } from "devextreme-angular";
// ...
export class AppComponent {
    // ...
}
@NgModule({
    imports: [
        // ...
        DxChartModule
    ],
    // ...
})
A bar's maximum width is limited. In single-series charts, it cannot be greater than the interval between two major ticks. In multi-series charts, it depends on the number of bars in the parent group and this group's actual width.
Bar groups' width can be changed using the barGroupWidth option. Like barWidth, it accepts values in degrees, but unlike it, applies to the entire chart. The groups' maximum width is the interval between two major ticks.
jQuery
$(function () {
    $("#chartContainer").dxChart({
        // ...
        barGroupWidth: 250
    });
});
Angular
<dx-chart ...
    [barGroupWidth]="250">
    <!-- ... -->
</dx-chart>
import { DxChartModule } from "devextreme-angular";
// ...
export class AppComponent {
    // ...
}
@NgModule({
    imports: [
        // ...
        DxChartModule
    ],
    // ...
})