jQuery Chart - argumentAxis.constantLines

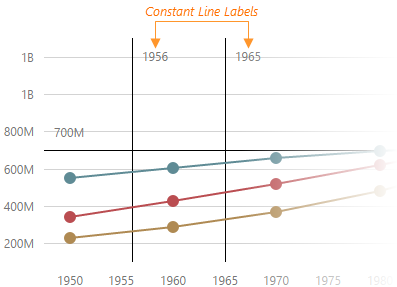
Each object in the constantLines array configures a single constant line. Setting the value option is necessary for a constant line to be displayed.
See Also
- argumentAxis.constantLineStyle - specifies the appearance of those constant lines that belong to the argument axis.
- commonAxisSettings.constantLineStyle - specifies the appearance of all constant lines in the widget.
color
This option supports the following colors:
- Hexadecimal colors
- RGB colors
- RGBA colors
- Predefined/cross-browser color names
- Predefined SVG colors
- Paint server address
dashStyle
The following dash styles are available:
solid
The border is a solid, continuous line.longDash
The border is displayed using long dashes.dash
The border is displayed using dashes.dot
The border is displayed using dots.Any combination of 'longDash', 'dash' and 'dot'
The border is displayed by repeating the specified combination. For instance, 'dashdotdash'.
Use the DashStyle enum to specify this option when the widget is used as an ASP.NET MVC 5 Control or a DevExtreme-Based ASP.NET Core Control. This enum accepts the following values: Solid, LongDash, Dash, and Dot.
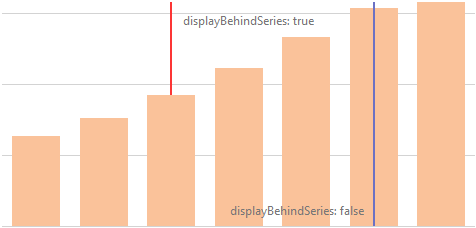
extendAxis
Specifies whether to extend the axis's default visual range to display the constant line.
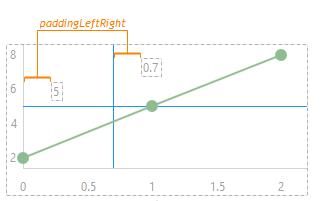
paddingLeftRight
Generates a pixel-measured empty space between the left/right side of a constant line and the constant line label.
This option depends on the label.horizontalAlignment in the following way.
- horizontalAlignment is "left" → padding applies to the left side of a constant line;
- horizontalAlignment is "right" → padding applies to the right side of a constant line;
- horizontalAlignment is "center" → padding is calculated automatically.
See Also
- argumentAxis.constantLineStyle.label.horizontalAlignment - aligns constant line labels in the horizontal direction. Applies to the constant lines belonging to the argument axis.
- valueAxis.constantLineStyle.label.horizontalAlignment - aligns constant line labels in the horizontal direction. Applies to the constant lines belonging to the value axis.
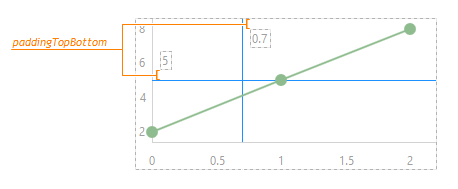
paddingTopBottom
Generates a pixel-measured empty space between the top/bottom side of a constant line and the constant line label.
This option depends on the label.verticalAlignment in the following way.
- verticalAlignment is "top" → padding applies to the top side of a constant line;
- verticalAlignment is "bottom" → padding applies to the bottom side of a constant line;
- verticalAlignment is "center" → padding is calculated automatically.
See Also
- argumentAxis.constantLineStyle.label.verticalAlignment - aligns constant line labels in the vertical direction. Applies to the constant lines belonging to the argument axis.
- valueAxis.constantLineStyle.label.verticalAlignment - aligns constant line labels in the vertical direction. Applies to the constant lines belonging to the value axis.