jQuery Chart - commonAxisSettings.constantLineStyle

The commonAxisSettings.constantLineStyle object, which is described here, specifies common settings for all constant lines in the chart. To configure only those constant lines that belong to a particular axis, use the following objects.
- argumentAxis.constantLineStyle
- valueAxis.constantLineStyle
To configure individual constant lines, use the following arrays of objects.
- argumentAxis.constantLines[]
- valueAxis.constantLines[]
Individual settings override axis-specific settings which, in their turn, override common settings.
color
This property supports the following colors:
- Hexadecimal colors
- RGB colors
- RGBA colors
- Predefined/cross-browser color names
- Predefined SVG colors
- Paint server address
dashStyle
The following dash styles are available:
solid
The border is a solid, continuous line.longDash
The border is displayed using long dashes.dash
The border is displayed using dashes.dot
The border is displayed using dots.Any combination of 'longDash', 'dash' and 'dot'
The border is displayed by repeating the specified combination. For instance, 'dashdotdash'.
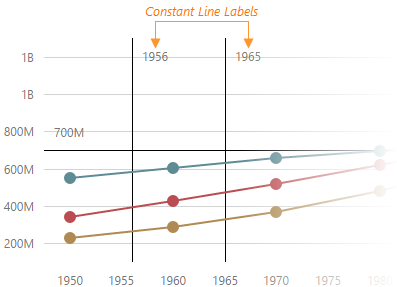
label
A constant line label displays the value of a constant line.
The commonAxisSettings.constantLineStyle.label object, which is described here, specifies common settings for all constant line labels in the chart. To configure the labels of those constant lines that belong to a particular axis, use the following objects.
To configure the labels of individual constant lines use the following objects.
Individual settings override axis-specific settings which, in their turn, override common settings.
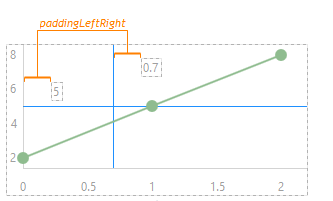
paddingLeftRight
Generates a pixel-measured empty space between the left/right side of a constant line and the constant line label.
This property depends on the label.horizontalAlignment in the following way.
- horizontalAlignment is "left" → padding applies to the left side of a constant line;
- horizontalAlignment is "right" → padding applies to the right side of a constant line;
- horizontalAlignment is "center" → padding is calculated automatically.
See Also
- argumentAxis.constantLineStyle.label.horizontalAlignment - aligns constant line labels in the horizontal direction. Applies to the constant lines belonging to the argument axis.
- valueAxis.constantLineStyle.label.horizontalAlignment - aligns constant line labels in the horizontal direction. Applies to the constant lines belonging to the value axis.
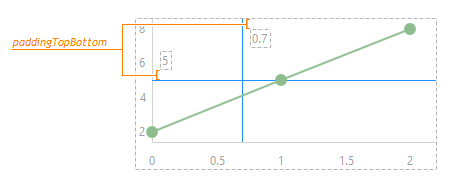
paddingTopBottom
Generates a pixel-measured empty space between the top/bottom side of a constant line and the constant line label.
This property depends on the label.verticalAlignment in the following way.
- verticalAlignment is "top" → padding applies to the top side of a constant line;
- verticalAlignment is "bottom" → padding applies to the bottom side of a constant line;
- verticalAlignment is "center" → padding is calculated automatically.
See Also
- argumentAxis.constantLineStyle.label.verticalAlignment - aligns constant line labels in the vertical direction. Applies to the constant lines belonging to the argument axis.
- valueAxis.constantLineStyle.label.verticalAlignment - aligns constant line labels in the vertical direction. Applies to the constant lines belonging to the value axis.