jQuery Sparkline - Series Types
The different sections of this guide describe the series types supported by the Sparkline UI component. Each topic covers information about one series type, its purpose, distinctive features and configuration properties.
Hover over any one of the sparklines below to discover its series type. Click a sparkline to navigate to the topic describing the corresponding series type in detail.
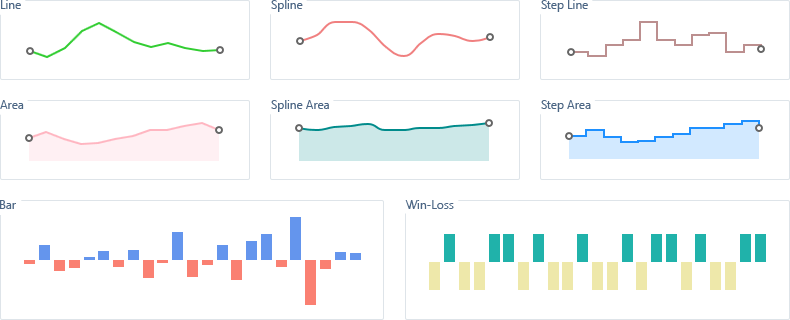
Line
A line series type sparkline presents data as a line that connects invisible points. This series type is useful when you need to visualize a data trend of specific intervals.

In the Sparkline UI component, the line series type is used by default. There may be times, however, when you will need to specify this series type explicitly. To do so, assign 'line' to the type property of the main configuration object.
var sparklineOptions = {
    type: 'line',
    // ...
};
You can use the lineColor and lineWidth properties to customize the appearance of a line series.
Regular points cannot be displayed in a line sparkline, but you can make extreme points visible. For further information, refer to the Series Points topic.
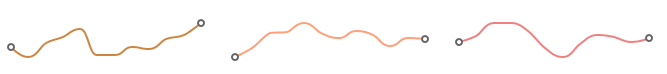
Spline
A spline series type sparkline presents data as a set of invisible points that are joined using a spline interpolation. This series type is suitable when you need to visualize a trend in data over intervals, but prefer joining lines to be smooth, in contrast to the line series type.
To specify the spline series type, assign 'spline' to the type property of the main configuration object.
var sparklineOptions = {
    type: 'spline',
    // ...
};
You can use the lineColor and lineWidth properties to customize the appearance of a spline series.
Regular points cannot be displayed in a spline sparkline, but you can make extreme points visible. For further information, refer to the Series Points topic.
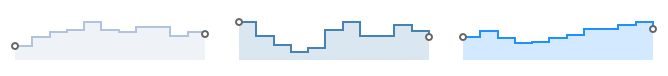
Step Line
A step line series type sparkline presents data as a line that connects a set of invisible points by using horizontal and vertical lines. This resulting sparkline resembles a series of steps.

To specify the step line series type, assign 'stepline' to the type property of the main configuration object.
var sparklineOptions = {
    type: 'stepline',
    // ...
};
You can use the lineColor and lineWidth properties to customize the appearance of a step line series.
Regular points cannot be displayed in a step line sparkline, but you can make extreme points visible. For further information, refer to the Series Points topic.
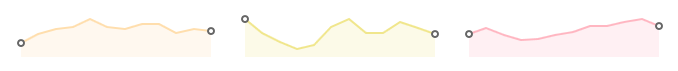
Area
An area series type sparkline is helpful when you need to emphasize a change in values. Data in this series type is presented by a broken line joining invisible points and a shaded area under this line.
To specify the area series type, assign 'area' to the type property of the main configuration object.
var sparklineOptions = {
    type: 'area',
    // ...
};
To change the color of an area sparkline, set the lineColor property. Note that both the line and the area under it will be painted in this color, but the area will be more transparent. In addition, you can specify the width of the line using the lineWidth property.
Regular points cannot be displayed in an area sparkline, but you can make extreme points visible. For further information, refer to the Series Points topic.
Spline Area
Similarly to area, the spline area series type presents data in the form of a line and a shaded area under it. But unlike in the area series, in a spline area series, this line is much smoother.

To specify the spline area series type, assign 'splinearea' to the type property of the main configuration object.
var sparklineOptions = {
    type: 'splinearea',
    // ...
};
To change the color of a spline area sparkline, set the lineColor property. Note that the line and the area under it will be painted in this color, with the part under the line in a more transparent fashion. In addition, you can specify the width of the line using the lineWidth property.
Regular points cannot be displayed in a spline area sparkline, but you can make extreme points visible. For further information, refer to the Series Points topic.
Step Area
A step area series type sparkline presents data as a line of joined horizontal and vertical lines that connects a set of invisible points. This line, which resembles staircase steps, is complemented with a shaded area beneath it.
To specify the step area series type, assign 'steparea' to the type property of the main configuration object.
var sparklineOptions = {
    type: 'steparea',
    // ...
};
To change the color of a step area sparkline, set the lineColor property. Note that both the line and the area under it will be painted in this color, but the area will be more transparent. In addition, you can specify the width of the line using the lineWidth property.
Regular points cannot be displayed in a step area sparkline, but you can make extreme points visible. For further information, refer to the Series Points topic.
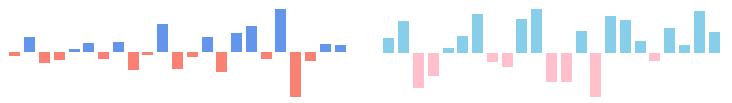
Bar
In the bar series type, data is displayed as a set of rectangular bars with heights proportional to indicated values. Usually, a bar series is used to compare values in discrete categories such as months, countries, age, etc.
To specify the bar series type, assign 'bar' to the type property of the main configuration object.
var sparklineOptions = {
    type: 'bar',
    // ...
};
The color of a particular bar in a series depends on the value it represents. If this value is greater than zero, this bar is painted in a "positive" color. Otherwise, it is painted in a "negative" color. These colors can be specified using the barPositiveColor and barNegativeColor properties.
In addition, you can indicate extreme points on a bar sparkline. To learn how to do this, refer to the Series Points topic.
Win-Loss
The win-loss series type will suit you best when you need to demonstrate whether or not some values have had success in exceeding a specific threshold value. This series type strongly resembles the bar series type. The fundamental difference is that while in a bar series, bars are classified as being greater or less than zero, in a win-loss series, they are classified as being greater or less than a specific value called "threshold".

To specify the win-loss series type, assign 'winloss' to the type property of the main configuration object.
var sparklineOptions = {
    type: 'winloss',
    // ...
};
After that, specify the value to be used as the threshold. Assign this value to the winlossThreshold property.
var sparklineOptions = {
    winlossThreshold: 2000,
    // ...
};
The color of a particular bar in a win-loss series depends on the value it represents. If this value is greater than the threshold, this bar is painted in a "win" color. Otherwise, it is painted in a "loss" color. These colors can be specified using the winColor and lossColor properties.
In addition, you can indicate extreme points on a win-loss sparkline. To learn how to do this, refer to the Series Points topic.