JavaScript/jQuery Chart - Crosshair
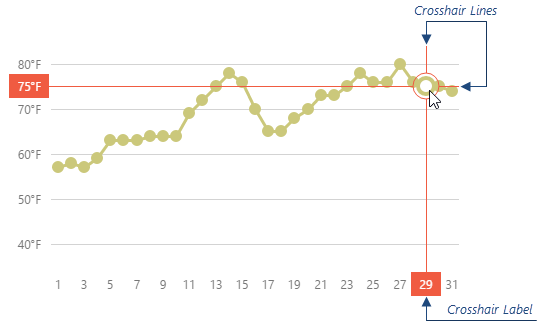
Crosshair is a pointer represented by two mutually-crossing lines stretched over the entire chart plot. The crosshair helps a user identify values of the series points precisely. When enabled, the crosshair follows the cursor and snaps to the nearest series point.

To enable the crosshair, set the crosshair.enabled property to true. To show the crosshair labels, do the same with the crosshair.label.visible property.
jQuery
JavaScript
$(function() {
    $("#chartContainer").dxChart({
        // ...
        crosshair: {
            enabled: true,
            label: {
                visible: true
            }
        }
    });
});
Angular
HTML
TypeScript
<dx-chart ... >
    <dxo-chart-crosshair [enabled]="true">
        <dxo-chart-label [visible]="true"></dxo-chart-label>
    </dxo-chart-crosshair>
</dx-chart>
import { DxChartModule } from "devextreme-angular";
// ...
export class AppComponent {
    // ...
}
@NgModule({
    imports: [
        // ...
        DxChartModule
    ],
    // ...
})
Vue
App.vue
<template>
    <DxChart ... >
        <DxCrosshair :enabled="true">
            <DxLabel :visible="true"/>
        </DxCrosshair>
    </DxChart>
</template>

<script>
import DxChart, {
    DxCrosshair,
    DxLabel
} from 'devextreme-vue/chart';

export default {
    components: {
        DxChart,
        DxCrosshair,
        DxLabel
    }
}
</script>
React
App.js
import React from 'react';
import Chart, {
    Crosshair,
    Label
} from 'devextreme-react/chart';

class App extends React.Component {
    render() {
        return (
            <Chart ... >
                <Crosshair enabled={true}>
                    <Label visible={true}/>
                </Crosshair>
            </Chart>
        );
    }
}

export default App;
For information about all properties of the crosshair and its labels, visit the crosshair section of the API reference.

 Select one or more answers