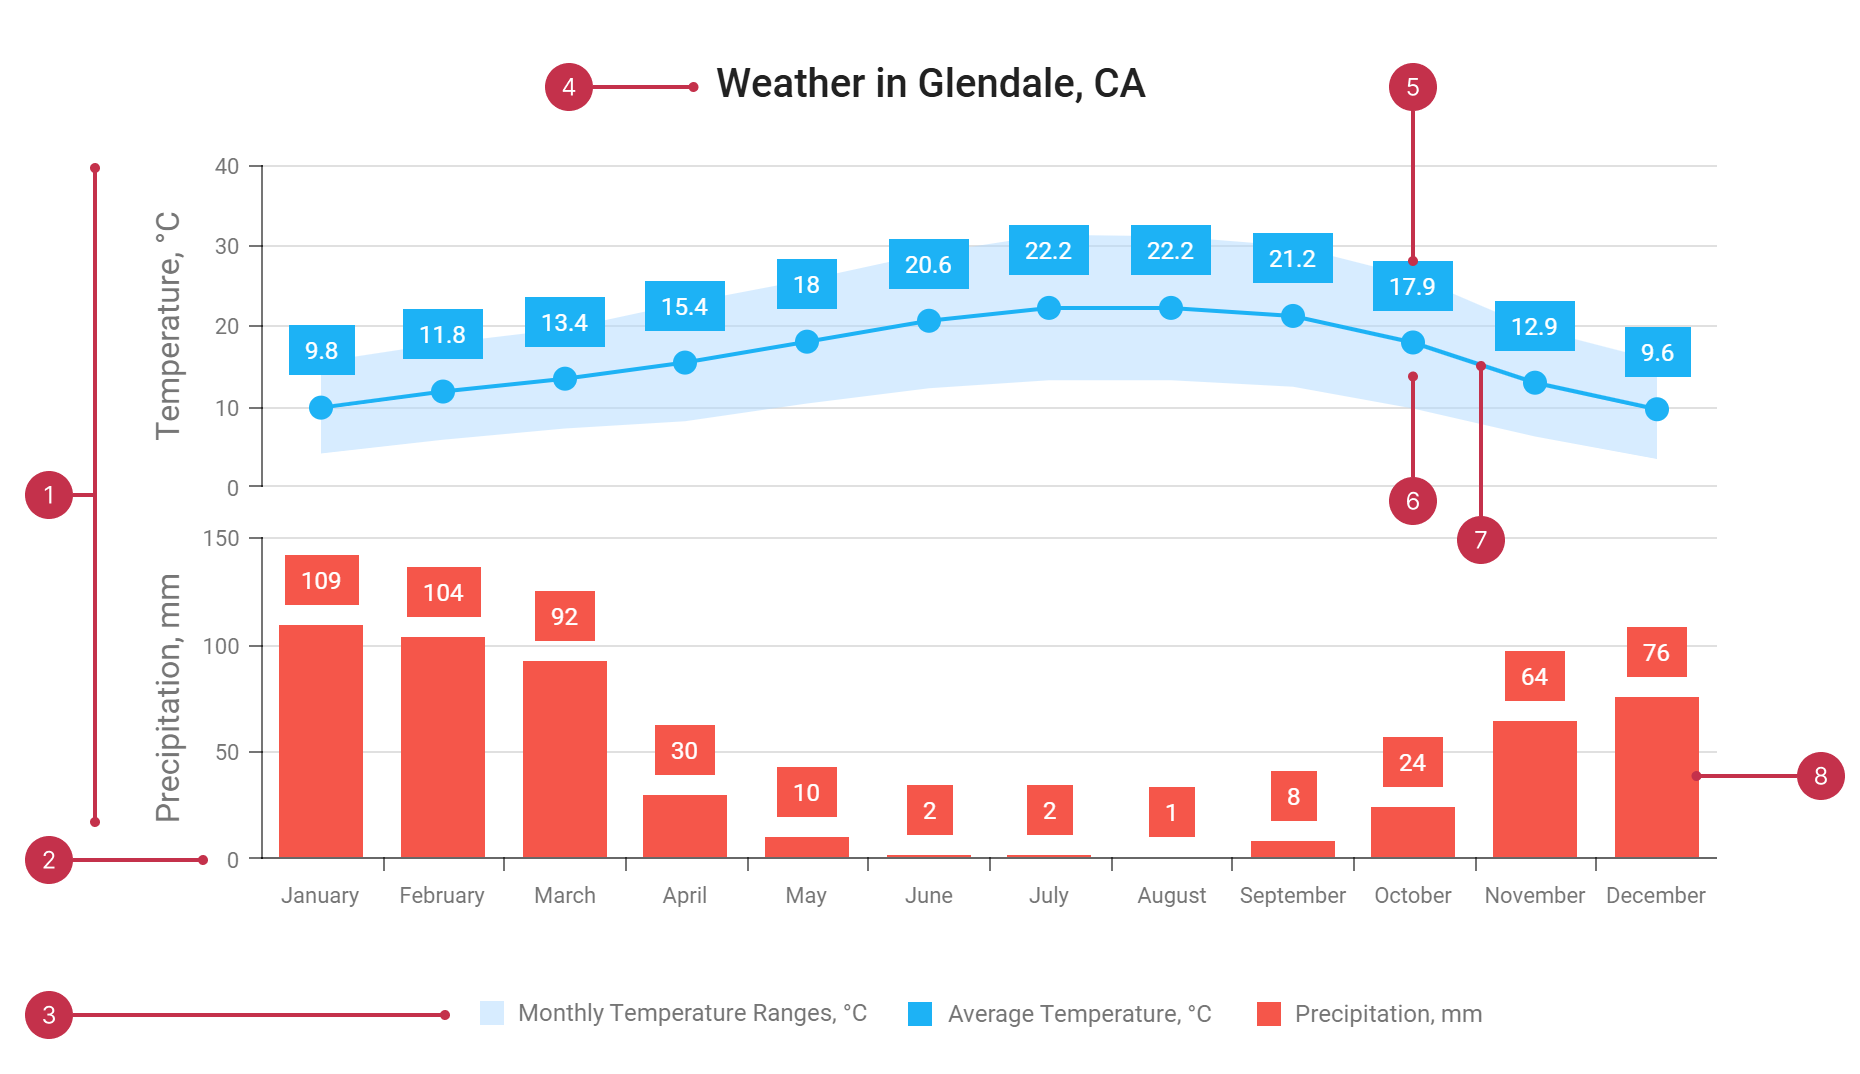
JavaScript/jQuery Chart - Overview
DevExtreme Chart is an interactive UI component that visualizes data from local or remote storage with various series types.
This overview highlights Chart elements, key features, and next steps.
Key Features
Series Types
The Chart component includes over 20 series types, with the most popular ones being:Combine them, customize appearance, and configure individual points.
Data Sources
Chart can load and update data from various data source types. Bind data directly or use a series template.Informational Elements
You can enhance the Chart with additional information elements, such as:Interactive Features
Add interactivity to your Chart with the following elements:Customization
The following Chart customizations are available:Data Aggregation
Charts with too many series points can impact performance and readability. To improve analysis, DevExtreme Chart supports point and discrete aggregation modes.


 Select one or more answers