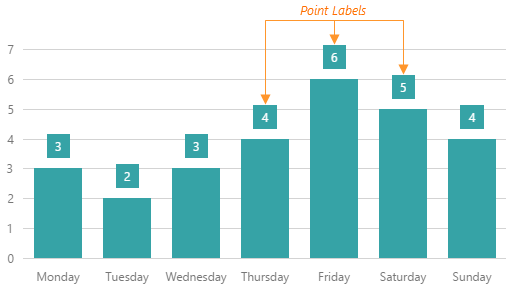
Chart - Point Labels Overview
Each series point can be accompanied with a label that displays the point's value(s) or custom data.

To configure point labels, use the fields of the label object. This object can be declared as follows.
jQuery
JavaScript
$(function() {
    $("#chartContainer").dxChart({
        // ...
        series: [{
            label: {
                // Settings for all point labels of an individual series
            }
        }, {
            // ...
        }],
        commonSeriesSettings: {
            label: {
                // Settings for all point labels in the Chart
            }
        }
    });
});
Angular
HTML
TypeScript
<dx-chart ... >
    <dxi-chart-series>
        <dxo-chart-label ... >
            <!-- Settings for all point labels of an individual series -->
        </dxo-chart-label>
    </dxi-chart-series>
    <dxo-chart-common-series-settings ... >
        <dxo-chart-label ... >
            <!-- Settings for all point labels in the Chart -->
        </dxo-chart-label>
    </dxo-chart-common-series-settings>
</dx-chart>
import { DxChartModule } from "devextreme-angular";
// ...
export class AppComponent {
    // ...
}
@NgModule({
    imports: [
        // ...
        DxChartModule
    ],
    // ...
})
Vue
App.vue
<template>
    <DxChart ... >
        <DxSeries>
            <DxLabel ... >
                <!-- Settings for all point labels of an individual series -->
            </DxLabel>
        </DxSeries>
        <DxCommonSeriesSettings ... >
            <DxLabel ... >
                <!-- Settings for all point labels in the Chart -->
            </DxLabel>
        </DxCommonSeriesSettings>
    </DxChart>
</template>

<script>
import DxChart, {
    DxSeries,
    DxCommonSeriesSettings,
    DxLabel
} from 'devextreme-vue/chart';

export default {
    components: {
        DxChart,
        DxSeries,
        DxCommonSeriesSettings,
        DxLabel
    }
}
</script>
React
App.js
import React from 'react';
import Chart, {
    Series,
    CommonSeriesSettings,
    Label
} from 'devextreme-react/chart';

class App extends React.Component {
    render() {
        return (
            <Chart ... >
                <Series>
                    <Label ... >
                        {/* Settings for all point labels of an individual series */}
                    </Label>
                </Series>
                <CommonSeriesSettings ... >
                    <Label ... >
                        {/* Settings for all point labels in the Chart */}
                    </Label>
                </CommonSeriesSettings>
            </Chart>
        );
    }
}

export default App;
Point labels are not visible by default. To make them visible, assign true to the label.visible property. With this configuration, point labels are displayed detached from their respective series points. You can make the connection between labels and points more evident by making label connectors visible. For this purpose, assign true to the label.connector.visible property.
jQuery
JavaScript
$(function() {
    $("#chartContainer").dxChart({
        // ...
        series: {
            label: {
                visible: true,
                connector: {
                    visible: true
                }
            }
        }
    });
});
Angular
HTML
TypeScript
<dx-chart ... >
    <dxi-chart-series>
        <dxo-chart-label [visible]="true">
            <dxo-chart-connector [visible]="true"></dxo-chart-connector>
        </dxo-chart-label>
    </dxi-chart-series>
</dx-chart>
import { DxChartModule } from "devextreme-angular";
// ...
export class AppComponent {
    // ...
}
@NgModule({
    imports: [
        // ...
        DxChartModule
    ],
    // ...
})
Vue
App.vue
<template>
    <DxChart ... >
        <DxSeries>
            <DxLabel :visible="true">
                <DxConnector :visible="true"/>
            </DxLabel>
        </DxSeries>
    </DxChart>
</template>

<script>
import DxChart, {
    DxSeries,
    DxLabel,
    DxConnector
} from 'devextreme-vue/chart';

export default {
    components: {
        DxChart,
        DxSeries,
        DxLabel,
        DxConnector
    }
}
</script>
React
App.js
import React from 'react';
import Chart, {
    Series,
    Connector,
    Label
} from 'devextreme-react/chart';

class App extends React.Component {
    render() {
        return (
            <Chart ... >
                <Series>
                    <Label visible={true}>
                        <Connector visible={true} />
                    </Label>
                </Series>
            </Chart>
        );
    }
}

export default App;
For details on other properties of point labels, refer to the label section of the API reference and to other topics in this section.
See Also

 Select one or more answers