Angular PivotGrid - Overview
PivotGrid is a UI component that allows you to display and analyze multi-dimensional data.
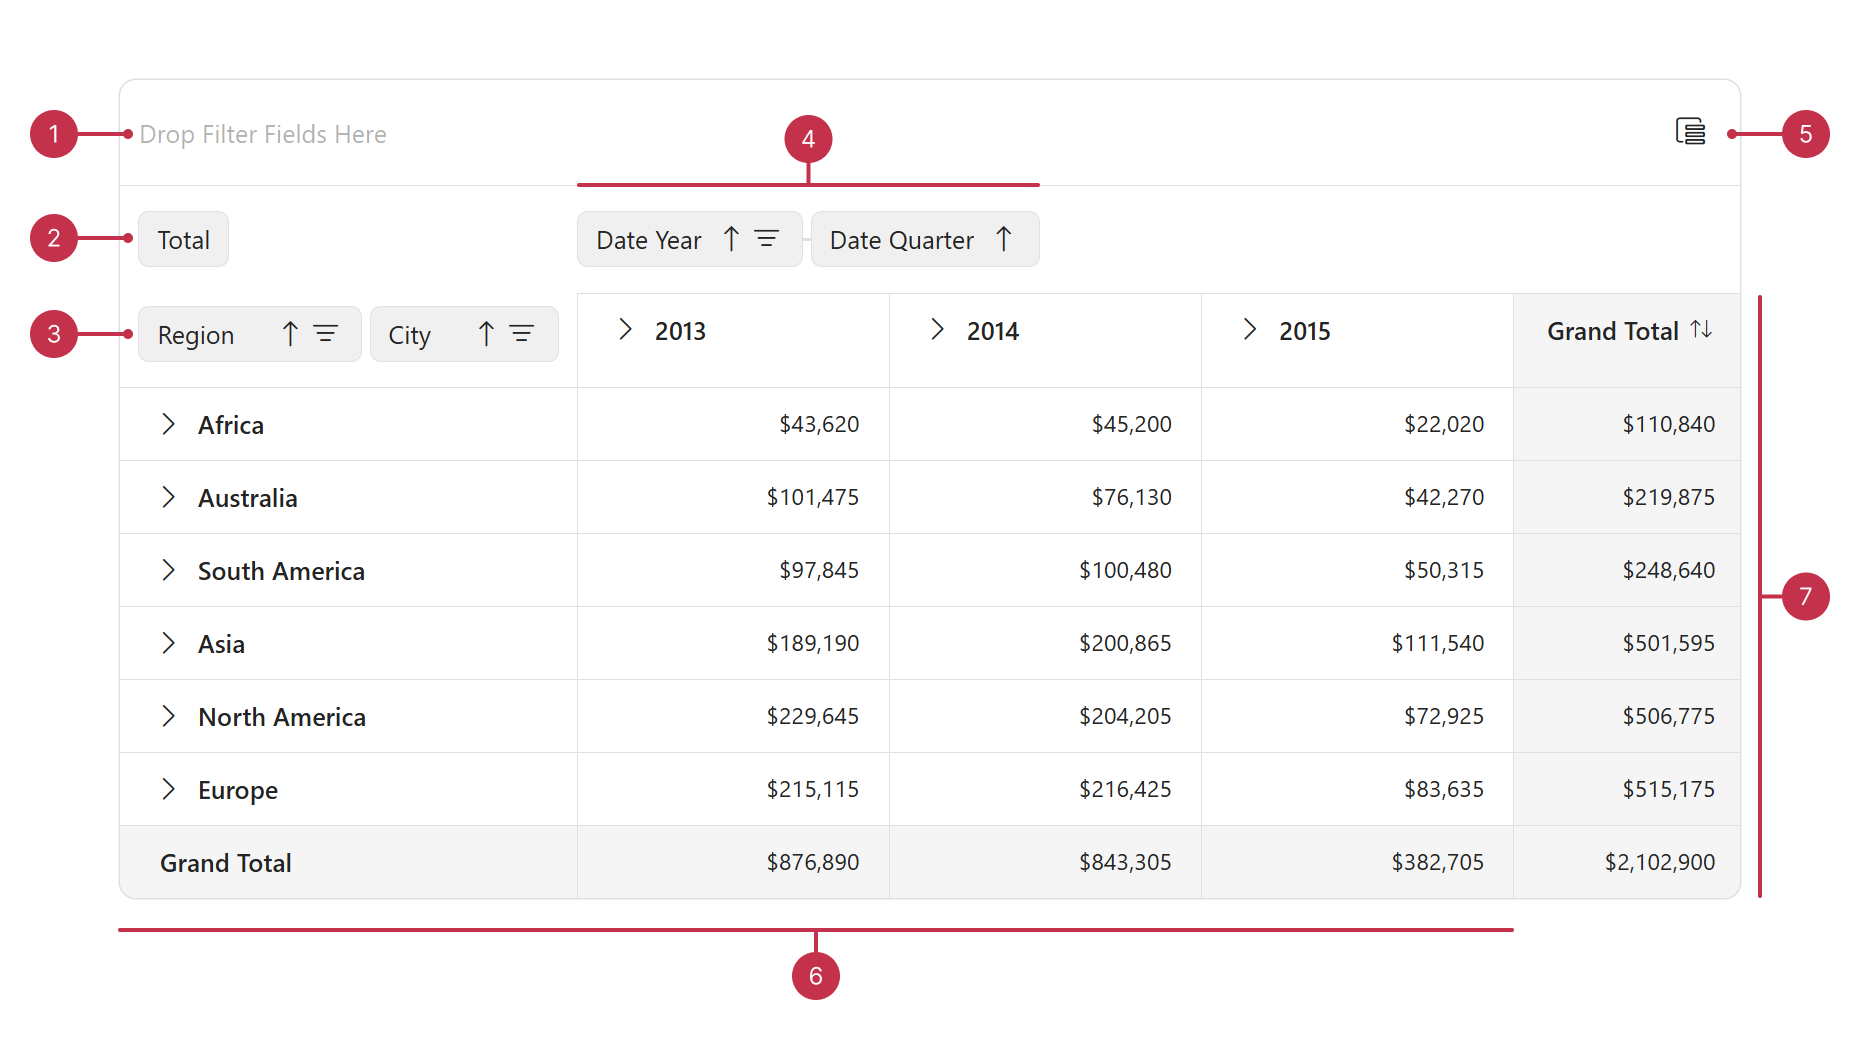
In this overview, you can find a map of PivotGrid elements, information about key features, and what to explore next.
Key Features
Data Binding
PivotGrid can display data from various sources: an in-memory array, HTML5 web storage, OData service, OLAP server, or a customized data source.Summary Calculation Modes
PivotGrid displays value summaries. Choose between predefined summaries, aggregate values, or a implement a custom summary.Customizable Layout
You can enable or disable multiple PivotGrid elements. Review the Visual Elements article for more information.Grouping, Sorting, and Filtering
PivotGrid groups data for header items and fields. Sort or filter fields through the UI or programmatically.Export to Excel
Export PivotGrid data to Excel in XLSX or CSV format and customize the exported cells.Chart Integration
PivotGrid handles large numeric datasets that can be hard to interpret. For a detailed data visualization, use the Chart component that integrates into PivotGrid.

 Select one or more answers