Box
API
Map
A newer version of this page is available. Switch to the current version.

JavaScript/jQuery Chart - valueAxis.constantLineStyle.label

Specifies the appearance of the labels of those constant lines that belong to the value axis.

A constant line label displays the value of a constant line.
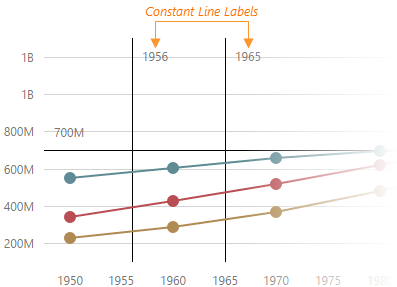
DevExtreme HTML5 Charts ConstantLine ConstantLineLabel

See Also
  • valueAxis.constantLines[].label - configures the labels of individual constant lines. Overrides the properties of the valueAxis.constantLineStyle.label object, which is described here.
  • commonAxisSettings.constantLineStyle.label - specifies the appearance of all constant line labels.

font

Specifies font properties for constant line labels.

Type:

Object

horizontalAlignment

Aligns constant line labels in the horizontal direction.

Default Value: 'left'

position

Specifies the position of constant line labels on the chart plot.

Default Value: 'inside'

By default, constant line labels are displayed inside the chart plot near the constant lines they belong to. To place the labels outside the chart plot, set the position property to "outside".

verticalAlignment

Aligns constant line labels in the vertical direction.

Default Value: 'top'

visible

Makes constant line labels visible.

Type:

Boolean

Default Value: true