JavaScript/jQuery Chart - valueAxis.constantLineStyle.label
Specifies the appearance of the labels of those constant lines that belong to the value axis.
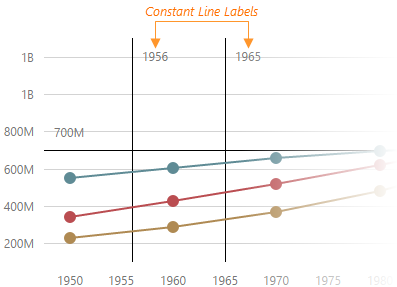
A constant line label displays the value of a constant line.
See Also
horizontalAlignment
Aligns constant line labels in the horizontal direction.
Type:
Default Value: 'left'
position
Specifies the position of constant line labels on the chart plot.
Type:
Default Value: 'inside'
By default, constant line labels are displayed inside the chart plot near the constant lines they belong to. To place the labels outside the chart plot, set the position property to "outside".

 Select one or more answers