JavaScript/jQuery PolarChart API
The PolarChart is a UI component that visualizes data in a polar coordinate system.
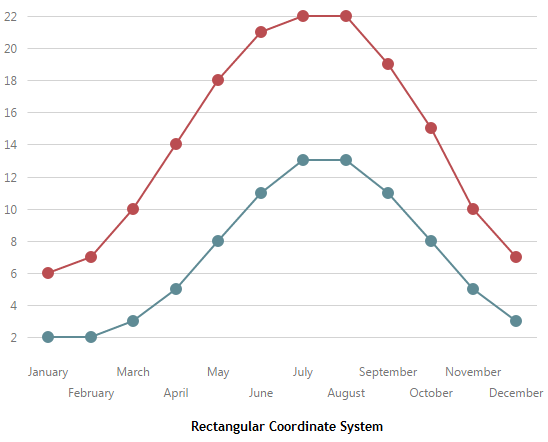
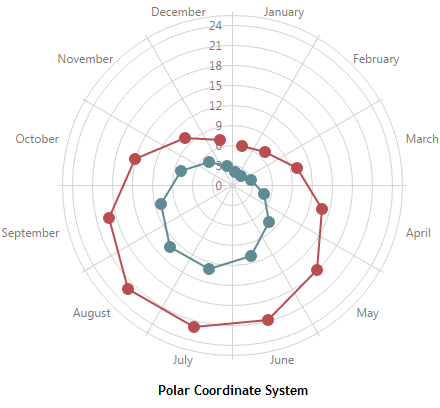
The PolarChart UI component visualizes data in a polar coordinate system. In this system, each point on a plane is determined by the distance from the center (the point's value) and the angle from a fixed direction (the point's argument). To understand how a chart is displayed in a polar coordinate system, imagine how it would be displayed in a rectangular coordinate system and then round off the argument axis in your mind.
See Also
jQuery
Angular
Vue
React
Options
An object defining configuration properties for the PolarChart UI component.
| Name | Description |
|---|---|
| adaptiveLayout | Specifies adaptive layout properties. |
| animation | Specifies animation properties. |
| annotations | Specifies the annotation collection. |
| argumentAxis | Specifies argument axis properties for the PolarChart UI component. |
| barGroupPadding | Controls the padding and consequently the angular width of a group of bars with the same argument using relative units. Ignored if the barGroupWidth property is set. |
| barGroupWidth | Specifies a fixed angular width for groups of bars with the same argument, measured in degrees. Takes precedence over the barGroupPadding property. |
| commonAnnotationSettings | Specifies settings common for all annotations in the PolarChart. |
| commonAxisSettings | An object defining the configuration properties that are common for all axes of the PolarChart UI component. |
| commonSeriesSettings | An object defining the configuration properties that are common for all series of the PolarChart UI component. |
| containerBackgroundColor | Specifies the color of the parent page element. |
| customizeAnnotation | Customizes an individual annotation. |
| customizeLabel | Customizes the appearance of an individual point label. |
| customizePoint | Customizes the appearance of an individual series point. |
| dataPrepareSettings | An object providing properties for managing data from a data source. |
| dataSource | Binds the UI component to data. |
| disabled | Specifies whether the UI component responds to user interaction. |
| elementAttr | Specifies the global attributes to be attached to the UI component's container element. |
| export | Configures the exporting and printing features. |
| legend | Specifies the properties of a chart's legend. |
| loadingIndicator | Configures the loading indicator. |
| margin | Generates space around the UI component. |
| negativesAsZeroes | Forces the UI component to treat negative values as zeroes. Applies to stacked-like series only. |
| onArgumentAxisClick | A function that is executed when a label on the argument axis is clicked or tapped. |
| onDisposing | A function that is executed before the UI component is disposed of. |
| onDone | A function that is executed when all series are ready. |
| onDrawn | A function that is executed when the UI component's rendering has finished. |
| onExported | A function that is executed after the UI component is exported. |
| onExporting | A function that is executed before the UI component is exported. |
| onFileSaving | A function that is executed before a file with exported UI component is saved to the user's local storage. |
| onIncidentOccurred | A function that is executed when an error or warning occurs. |
| onInitialized | A function used in JavaScript frameworks to save the UI component instance. |
| onLegendClick | A function that is executed when a legend item is clicked or tapped. |
| onOptionChanged | A function that is executed after a UI component property is changed. |
| onPointClick | A function that is executed when a series point is clicked or tapped. |
| onPointHoverChanged | A function that is executed after the pointer enters or leaves a series point. |
| onPointSelectionChanged | A function that is executed when a series point is selected or selection is canceled. |
| onSeriesClick | A function that is executed when a series is clicked or tapped. |
| onSeriesHoverChanged | A function that is executed after the pointer enters or leaves a series. |
| onSeriesSelectionChanged | A function that is executed when a series is selected or selection is canceled. |
| onTooltipHidden | A function that is executed when a tooltip becomes hidden. |
| onTooltipShown | A function that is executed when a tooltip appears. |
| onZoomEnd | A function that is executed when zooming or panning ends. |
| onZoomStart | A function that is executed when zooming or panning begins. |
| palette | Sets the palette to be used for colorizing series and their elements. |
| paletteExtensionMode | Specifies what to do with colors in the palette when their number is less than the number of series (in the Chart UI component) or points in a series (in the PieChart UI component). |
| pathModified | Notifies the UI component that it is embedded into an HTML page that uses a tag modifying the path. |
| pointSelectionMode | Specifies whether a single point or multiple points can be selected in the chart. |
| redrawOnResize | Specifies whether to redraw the UI component when the size of the container changes or a mobile device rotates. |
| resolveLabelOverlapping | Specifies how the chart must behave when series point labels overlap. |
| rtlEnabled | Switches the UI component to a right-to-left representation. |
| series | Specifies properties for PolarChart UI component series. |
| seriesSelectionMode | Specifies whether a single series or multiple series can be selected in the chart. |
| seriesTemplate | Defines properties for the series template. |
| size | Specifies the UI component's size in pixels. |
| theme | Sets the name of the theme the UI component uses. |
| title | Configures the UI component's title. |
| tooltip | |
| useSpiderWeb | Indicates whether to display a "spider web". |
| valueAxis | Specifies value axis properties for the PolarChart UI component. |
See Also
Methods
| Name | Description |
|---|---|
| beginUpdate() | Postpones rendering that can negatively affect performance until the endUpdate() method is called. |
| clearSelection() | Deselects the chart's selected series. The series is displayed in an initial style. |
| dispose() | Disposes of all the resources allocated to the PolarChart instance. |
| element() | Gets the root UI component element. |
| endUpdate() | Refreshes the UI component after a call of the beginUpdate() method. |
| exportTo(fileName, format) | Exports the UI component. |
| getAllSeries() | Gets all the series. |
| getDataSource() | Gets the DataSource instance. |
| getInstance(element) | Gets the instance of a UI component found using its DOM node. |
| getSeriesByName(seriesName) | Gets a series with a specific name. |
| getSeriesByPos(seriesIndex) | Gets a series with a specific index. |
| getSize() | Gets the current UI component size. |
| getValueAxis() | Gets a value axis. |
| hideLoadingIndicator() | Hides the loading indicator. |
| hideTooltip() | Hides all UI component tooltips. |
| instance() | Gets the UI component's instance. Use it to access other methods of the UI component. |
| off(eventName) | Detaches all event handlers from a single event. |
| off(eventName, eventHandler) | Detaches a particular event handler from a single event. |
| on(eventName, eventHandler) | Subscribes to an event. |
| on(events) | Subscribes to events. |
| option() | Gets all UI component properties. |
| option(optionName) | Gets the value of a single property. |
| option(optionName, optionValue) | Updates the value of a single property. |
| option(options) | Updates the values of several properties. |
| print() | Opens the browser's print window. |
| refresh() | Reloads data and repaints the UI component. |
| render() | Redraws the UI component. |
| render(renderOptions) | Redraws the UI component. |
| resetOption(optionName) | Resets a property to its default value. |
| resetVisualRange() | Resets the value axis' visual range to the data range or to the whole range if it is within the data range. |
| showLoadingIndicator() | Shows the loading indicator. |
| svg() | Gets the UI component's SVG markup. |
See Also
Events
This section describes events fired by this UI component.
| Name | Description |
|---|---|
| argumentAxisClick | Raised when a label on the argument axis is clicked or tapped. |
| disposing | Raised before the UI component is disposed of. |
| done | Raised when all series are ready. |
| drawn | Raised when the UI component's rendering has finished. |
| exported | Raised after the UI component is exported. |
| exporting | Raised before the UI component is exported. |
| fileSaving | Raised before a file with exported UI component is saved to the user's local storage. |
| incidentOccurred | Raised when an error or warning occurs. |
| initialized | Raised only once, after the UI component is initialized. |
| legendClick | Raised when a legend item is clicked or tapped. |
| optionChanged | Raised after a UI component property is changed. |
| pointClick | Raised when a series point is clicked or tapped. |
| pointHoverChanged | Raised after the pointer enters or leaves a series point. |
| pointSelectionChanged | Raised when a series point is selected or selection is canceled. |
| seriesClick | Raised when a series is clicked or tapped. |
| seriesHoverChanged | Raised after the pointer enters or leaves a series. |
| seriesSelectionChanged | Raised when a series is selected or selection is canceled. |
| tooltipHidden | Raised when a tooltip becomes hidden. |
| tooltipShown | Raised when a tooltip appears. |
| zoomEnd | Raised when zooming or panning ends. |
| zoomStart | Raised when zooming or panning begins. |
See Also
Series Types
This section lists objects that define properties used to configure series of specific types.
| Name | Description |
|---|---|
| AreaSeries | An object defining a series of the area type. |
| BarSeries | An object defining a series of the bar type. |
| LineSeries | An object defining a series of the line type. |
| ScatterSeries | An object defining a series of the scatter type. |
| StackedBarSeries | An object defining a series of the stackedBar type. |
Types
| Name | Description |
|---|---|
| AdaptiveLayout | Specifies adaptive layout properties. |
| ArgumentAxis | Specifies argument axis properties for the PolarChart UI component. |
| ArgumentAxisClickEvent | The type of the argumentAxisClick event handler's argument. |
| ArgumentAxisConstantLines | Defines an array of the argument axis constant lines. |
| ArgumentAxisConstantLinesLabel | An object defining constant line label properties. |
| ArgumentAxisLabel | Specifies properties for argument axis labels. |
| ArgumentAxisMinorTick | |
| ArgumentAxisStrips | Specifies properties for argument axis strips. |
| ArgumentAxisStripsLabel | An object that defines the label configuration properties of a strip. |
| ArgumentAxisTick | |
| CommonAxisSettings | An object defining the configuration properties that are common for all axes of the PolarChart UI component. |
| CommonAxisSettingsConstantLineStyle | Specifies the appearance of all the UI component's constant lines. |
| CommonAxisSettingsConstantLineStyleLabel | An object defining constant line label properties. |
| CommonAxisSettingsLabel | An object defining the label configuration properties that are common for all axes in the PolarChart UI component. |
| CommonAxisSettingsMinorTick | Specifies the properties of the minor ticks. |
| CommonAxisSettingsStripStyle | An object defining configuration properties for strip style. |
| CommonAxisSettingsStripStyleLabel | An object defining the configuration properties for a strip label style. |
| CommonAxisSettingsTick | An object defining the configuration properties for axis ticks. |
| CommonSeriesSettings | An object defining the configuration properties that are common for all series of the PolarChart UI component. |
| DisposingEvent | The type of the disposing event handler's argument. |
| DoneEvent | The type of the done event handler's argument. |
| DrawnEvent | The type of the drawn event handler's argument. |
| dxPolarChartPointInfo | Series point data. |
| ExportedEvent | The type of the exported event handler's argument. |
| ExportingEvent | The type of the exporting event handler's argument. |
| FileSavingEvent | The type of the fileSaving event handler's argument. |
| IncidentOccurredEvent | The type of the incidentOccurred event handler's argument. |
| InitializedEvent | The type of the initialized event handler's argument. |
| Legend | Specifies the properties of a chart's legend. |
| LegendClickEvent | The type of the legendClick event handler's argument. |
| OptionChangedEvent | The type of the optionChanged event handler's argument. |
| PointClickEvent | The type of the pointClick event handler's argument. |
| PointHoverChangedEvent | The type of the pointHoverChanged event handler's argument. |
| PointSelectionChangedEvent | The type of the pointSelectionChanged event handler's argument. |
| PolarChartSeriesType | Sets a series type. |
| SeriesClickEvent | The type of the seriesClick event handler's argument. |
| SeriesHoverChangedEvent | The type of the seriesHoverChanged event handler's argument. |
| SeriesSelectionChangedEvent | The type of the seriesSelectionChanged event handler's argument. |
| Tooltip | |
| TooltipHiddenEvent | The type of the tooltipHidden event handler's argument. |
| TooltipShownEvent | The type of the tooltipShown event handler's argument. |
| ValueAxis | Specifies value axis properties for the PolarChart UI component. |
| ValueAxisConstantLines | Defines an array of the value axis constant lines. |
| ValueAxisConstantLinesLabel | An object defining constant line label properties. |
| ValueAxisLabel | Specifies properties for value axis labels. |
| ValueAxisStrips | Specifies properties for value axis strips. |
| ValueAxisStripsLabel | An object that defines the label configuration properties of a strip. |
| ValueAxisTick | |
| ValueAxisVisualRangeUpdateMode | Specifies how the axis's visual range should behave when the PolarChart data is updated. |
| ZoomEndEvent | The type of the zoomEnd event handler's argument. |
| ZoomStartEvent | The type of the zoomStart event handler's argument. |

 Select one or more answers