Chart - Panes Overview
A pane is a chart area containing series. If there are many series in the Chart, they can be distributed between multiple panes.
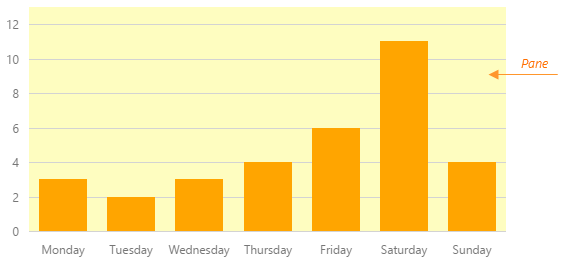
Panes are configured by the panes property. For a single-pane chart, this property accepts an object that configures the background color and the border of the pane.
jQuery
JavaScript
$(function() {
    $("#chartContainer").dxChart({
        // ...
        panes: {
            backgroundColor: 'yellow',
            border: {
                visible: true,
                width: 2
            }
        }
    });
});
Angular
HTML
TypeScript
<dx-chart ... >
    <dxi-panes backgroundColor="yellow">
        <dxo-chart-border
            [visible]="true"
            [width]="2">
        </dxo-chart-border>
    </dxi-panes>
</dx-chart>
import { DxChartModule } from "devextreme-angular";
// ...
export class AppComponent {
    // ...
}
@NgModule({
    imports: [
        // ...
        DxChartModule
    ],
    // ...
})
Vue
App.vue
<template>
    <DxChart ... >
        <DxPane background-color="yellow">
            <DxBorder
                :visible="true"
                :width="2"
            />
        </DxPane>
    </DxChart>
</template>

<script>
import DxChart, {
    DxPane,
    DxBorder
} from 'devextreme-vue/chart';

export default {
    components: {
        DxChart,
        DxPane,
        DxBorder
    }
}
</script>
React
App.js
import React from 'react';
import Chart, {
    Pane,
    Border
} from 'devextreme-react/chart';

class App extends React.Component {
    render() {
        return (
            <Chart ... >
                <Pane backgroundColor="yellow">
                    <Border
                        visible={true}
                        width={2}
                    />
                </Pane>
            </Chart>
        );
    }
}

export default App;
For a multi-pane chart, the panes property accepts an array. For further details, refer to the Multi-Pane Chart topic.
You can add custom styles (pattern or gradient) to the pane's background. To learn more, refer to the following API section: backgroundColor.
See Also
Feel free to share topic-related thoughts here.
If you have technical questions, please create a support ticket in the DevExpress Support Center.
Thank you for the feedback!
If you have technical questions, please create a support ticket in the DevExpress Support Center.