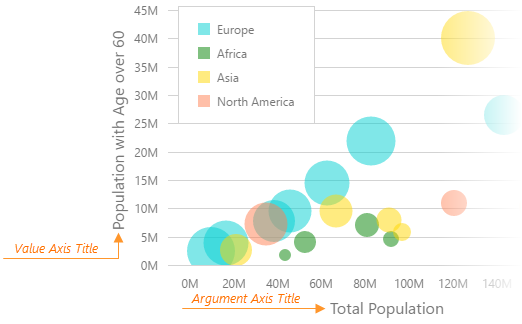
Vue Chart - commonAxisSettings.title
Configures axis titles.
Usually, an axis title displays units of measurement for values displayed by an axis. However, you can display any needed text in the axis title.

The commonAxisSettings.title object, which is described here, specifies common settings for all axis titles in the chart. To configure only the axis title that belongs to a particular axis, use the following objects.
Axis-specific settings override common settings.
See Also
margin
Adds a pixel-measured empty space between the axis title and axis labels.

textOverflow
Specifies what to do with the axis title when it overflows the allocated space after applying wordWrap: hide, truncate them and display an ellipsis, or do nothing.
wordWrap
Specifies how to wrap the axis title if it does not fit into a single line.
The following modes are available:
"normal"
Text breaks only at allowed breakpoints (for example, a space between two words)."breakWord"
Words can be broken if there are no available breakpoints in the line."none"
Word wrap is disabled.
If the text overflows the container even after word wrap, the UI component applies the textOverflow property.

 Select one or more answers