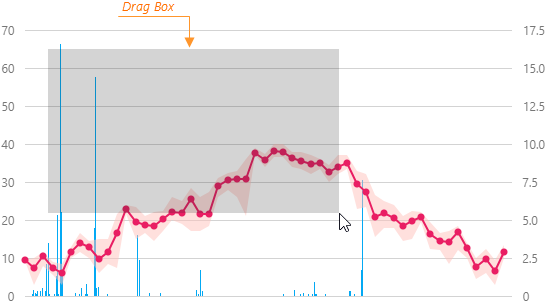
JavaScript/jQuery Chart - zoomAndPan.dragBoxStyle
Configures the box that appears when users zoom the chart by selecting an area with the drag gesture. Applies only if dragToZoom is true.
Type:

color
Specifies the drag box's color.
Type:
Default Value: undefined
This option supports the following colors:
- Hexadecimal colors
- RGB colors
- RGBA colors
- Predefined/cross-browser color names
- Predefined SVG colors

 Select one or more answers