DevExtreme jQuery/JS - Overview
A pane is a chart area containing series. If there are many series in the Chart, they can be distributed between multiple panes.
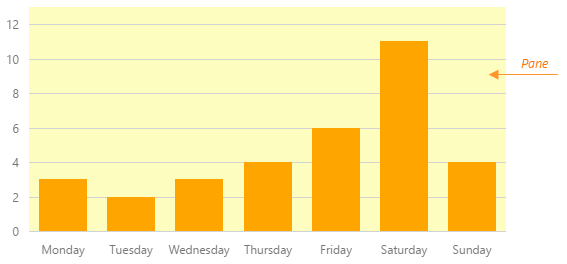
Panes are configured by the panes option. For a single-pane chart, this option accepts an object that configures the background color and the border of the pane.
jQuery
JavaScript
$(function() {
    $("#chartContainer").dxChart({
        // ...
        panes: {
            backgroundColor: 'yellow',
            border: {
                visible: true,
                width: 2
            }
        }
    });
});
Angular
HTML
TypeScript
<dx-chart ... >
    <dxi-panes backgroundColor="yellow">
        <dxo-border
            [visible]="true"
            [width]="2">
        </dxo-border>
    </dxi-panes>
</dx-chart>
import { DxChartModule } from "devextreme-angular";
// ...
export class AppComponent {
    // ...
}
@NgModule({
    imports: [
        // ...
        DxChartModule
    ],
    // ...
})
For a multi-pane chart, the panes option accepts an array. For further details, refer to the Multi-Pane Chart topic.
See Also

 Select one or more answers