JavaScript/jQuery Chart - Visual and Whole Ranges
The visual and whole ranges help you control which part of the axis a user sees and interacts with. Both ranges are available for the argument and value axes.
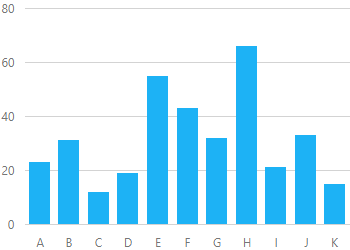
The visual range specifies the axis range visible to the user. Use it to focus the Chart on a specific part of the series. The following image illustrates the difference between charts with and without the specified visual range:
![Visual range is ["A", "F"]](/Content/images/doc/25_2/ChartJS/visual-range-specified.png)
Users can change the visual range if zooming and panning are enabled. However, users cannot move the visual range outside the data range (to an area with no data). If they should be able to do this, specify the whole range. It sets new limits for the visual range.
Both ranges can be specified using the start and end values or length. Refer to the visualRange or wholeRange property's description for more information.
To change the visual range programmatically, call the Axis object's visualRange(visualRange) method. Calling the same method without arguments allows you to get the current visual range:
jQuery
$(function() {
    var chart = $("#chartContainer").dxChart({
        // ...
        argumentAxis: {
            visualRange: [50, 70]
        }
    }).dxChart("instance");

    var argAxis = chart.getArgumentAxis();
    console.log(argAxis.visualRange()); // outputs { startValue: 50, endValue: 70 }
    argAxis.visualRange([40, 60]); // sets a new visual range
});
If your framework supports two-way binding, bind the axis' visualRange to a component property that you will change afterwards:
Angular
<dx-chart ... >
    <dxo-chart-argument-axis
        [(visualRange)]="chart_visualRange">
    </dxo-chart-argument-axis>
</dx-chart>
<dx-button
    text="Change Visual Range"
    (onClick)="chart_visualRange = [40, 60]">
</dx-button>
import { DxChartModule, DxButtonModule } from "devextreme-angular";
// ...
export class AppComponent {
    chart_visualRange = [50, 70];
}
@NgModule({
    imports: [
        // ...
        DxChartModule,
        DxButtonModule
    ],
    // ...
})
Vue
<template>
    <DxChart ... >
        <DxArgumentAxis
            v-model:visual-range="chart_visualRange"
        />
    </DxChart>
    <DxButton
        text="Change Visual Range"
        @click="setChartRange()"
    />
</template>

<script>
import DxChart, {
    DxArgumentAxis
} from 'devextreme-vue/chart';
import DxButton from 'devextreme-vue/button';

export default {
    components: {
        DxChart,
        DxArgumentAxis,
        DxButton
    },
    data() {
        return {
            chart_visualRange: []
        };
    },
    methods: {
        setChartRange() {
            this.chart_visualRange = [40, 60];
        }
    }
}
</script>
React
import React from 'react';
import Chart, {
    ArgumentAxis
} from 'devextreme-react/chart';
import Button from 'devextreme-react/button';

class App extends React.Component {
    constructor(props) {
        super(props);
        this.state = { chart_visualRange: [] };
        this.setChartRange = () => this.setState({ chart_visualRange: [40, 60] });
    }

    render() {
        return (
            <React.Fragment>
            <Chart
                onOptionChanged={this.handleChange}>
                <ArgumentAxis
                    visualRange={this.state.chart_visualRange}
                />
            </Chart>
            <Button
                text="Change Visual Range"
                onClick={this.setChartRange}
            />
            </React.Fragment>
        );
    }

    handleChange(e) {
        if(e.fullName === 'argumentAxis.visualRange') {
            const range = e.value;
            // ...
        }
    }
}

export default App;
An axis' visual range can behave differently when chart data is updated. See the visualRangeUpdateMode property for the argument axis or value axis for more information.
See Also

 Select one or more answers