JavaScript/jQuery Chart - Scale Breaks
A scale break is an area across an axis that is displayed instead of a section of an axis range. Scale breaks improve the readability of chart sections with large gaps in their ranges. Scale breaks are available for continuous or logarithmic type axes only.
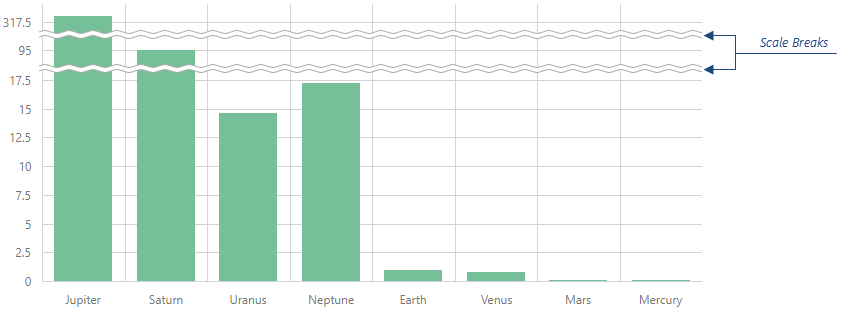
Use an axis' breaks array to declare a scale break collection. Each object in this array must have the startValue and endValue fields that limit a single scale break. A scale break range should be at least two tick intervals. Otherwise, the break might not be visible.
jQuery
$(function() {
    $("#chartContainer").dxChart({
        // ...
        valueAxis: { // or argumentAxis
            breaks: [
                { startValue: 100, endValue: 500 },
                { startValue: 1000, endValue: 2000 }
            ]
        }
    });
});
Angular
<dx-chart ... >
    <dxi-chart-value-axis> <!-- or <dxo-argument-axis> -->
        <dxi-chart-break [startValue]="100" [endValue]="500"></dxi-chart-break>
        <dxi-chart-break [startValue]="1000" [endValue]="2000"></dxi-chart-break>
    </dxi-chart-value-axis>
</dx-chart>
import { DxChartModule } from "devextreme-angular";
// ...
export class AppComponent {
    // ...
}
@NgModule({
    imports: [
        // ...
        DxChartModule
    ],
    // ...
})
Vue
<template>
    <DxChart ... >
        <DxValueAxis> <!-- or DxArgumentAxis -->
            <DxBreak
                :start-value="100"
                :end-value="500"
            />
            <DxBreak
                :start-value="1000"
                :end-value="2000"
            />
        </DxValueAxis>
    </DxChart>
</template>

<script>
import DxChart, {
    DxValueAxis,
    DxBreak
} from 'devextreme-vue/chart';

export default {
    components: {
        DxChart,
        DxValueAxis,
        DxBreak
    }
}
</script>
React
import React from 'react';
import Chart, {
    ValueAxis,
    Break
} from 'devextreme-react/chart';

export default function App() {
    return (
        <Chart ... >
            <ValueAxis> {/* or ArgumentAxis */}
                <Break
                    startValue={100}
                    endValue={500}
                />
                <Break
                    startValue={1000}
                    endValue={2000}
                />
            </ValueAxis>
        </Chart>
    );
}
The value axis supports auto-calculated scale breaks, which can be enabled by setting the autoBreaksEnabled property to true. You can specify the maxAutoBreakCount property to limit the number of scale breaks the UI component can generate.
jQuery
$(function() {
    $("#chartContainer").dxChart({
        // ...
        valueAxis: {
            autoBreaksEnabled: true,
            maxAutoBreakCount: 2
        }
    });
});
Angular
<dx-chart ... >
    <dxi-chart-value-axis
        [autoBreaksEnabled]="true"
        [maxAutoBreakCount]="2">
    </dxi-chart-value-axis>
</dx-chart>
import { DxChartModule } from "devextreme-angular";
// ...
export class AppComponent {
    // ...
}
@NgModule({
    imports: [
        // ...
        DxChartModule
    ],
    // ...
})
Vue
<template>
    <DxChart ... >
        <DxValueAxis
            :auto-breaks-enabled="true"
            :max-auto-break-count="2"
        /> <!-- or DxArgumentAxis -->
    </DxChart>
</template>

<script>
import DxChart, {
    DxValueAxis
} from 'devextreme-vue/chart';

export default {
    components: {
        DxChart,
        DxValueAxis
    }
}
</script>
React
import React from 'react';
import Chart, {
    ValueAxis
} from 'devextreme-react/chart';

export default function App() {
    return (
        <Chart ... >
            <ValueAxis
                autoBreaksEnabled={true}
                maxAutoBreakCount={2}
            /> {/* or ArgumentAxis */}
        </Chart>
    );
}
See Also

 Select one or more answers