React Chart - Multi-Pane Chart
A multi-pane chart distributes a collection of series between several panes, thus presenting data in a clear and uncluttered way.
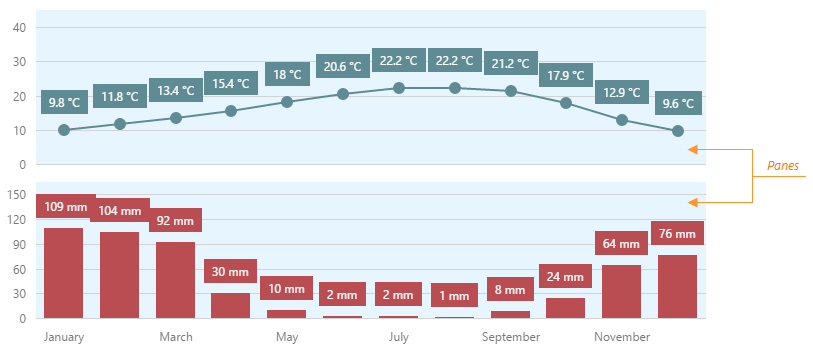
To configure a multi-pane chart, follow the steps below.
Create and name the panes
Declare several objects in the panes array. Each object configures a single pane. Then, give each pane a unique name.jQuery
JavaScript$(function() { $("#chartContainer").dxChart({ // ... panes: [ { name: 'topPane' }, { name: 'bottomPane' } ] }); });Angular
HTMLTypeScript<dx-chart ... > <dxi-panes name="topPane"></dxi-panes> <dxi-panes name="bottomPane"></dxi-panes> </dx-chart>import { DxChartModule } from "devextreme-angular"; // ... export class AppComponent { // ... } @NgModule({ imports: [ // ... DxChartModule ], // ... })Vue
React
import React from 'react'; import Chart, { Pane } from 'devextreme-react/chart';
class App extends React.Component { render() { return (
export default App;
Bind value axes to panes
If a Chart has multiple panes, it most likely has multiple value axes. Bind each of them to a pane using the pane property.jQuery
JavaScript$(function() { $("#chartContainer").dxChart({ // ... valueAxis: [ { pane: 'topPane' }, { pane: 'bottomPane' } ] }); });Angular
HTMLTypeScript<dx-chart ... > ... <dxi-chart-value-axis pane="topPane"></dxi-chart-value-axis> <dxi-chart-value-axis pane="bottomPane"></dxi-chart-value-axis> </dx-chart>import { DxChartModule } from "devextreme-angular"; // ... export class AppComponent { // ... } @NgModule({ imports: [ // ... DxChartModule ], // ... })Vue
React
import React from 'react'; import Chart, { ValueAxis } from 'devextreme-react/chart';
class App extends React.Component { render() { return (
export default App;
Bind series to panes
Bind each series to a pane using the pane property like you did for value axes in the previous step. If the pane property is missing from the series configuration, such a series will be bound to the defaultPane.jQuery
JavaScript$(function() { $("#chartContainer").dxChart({ // ... defaultPane: 'topPane', series: [{ pane: 'topPane' }, { pane: 'bottomPane' }, { pane: 'topPane' }, { // This series will be bound to the default pane }] }); });Angular
HTMLTypeScript<dx-chart ... defaultPane="topPane"> ... <dxi-chart-series pane="topPane"></dxi-chart-series> <dxi-chart-series pane="bottomPane"></dxi-chart-series> <dxi-chart-series pane="topPane"></dxi-chart-series> <dxi-chart-series> <!-- This series will be bound to the default pane --> </dxi-chart-series> </dx-chart>import { DxChartModule } from "devextreme-angular"; // ... export class AppComponent { // ... } @NgModule({ imports: [ // ... DxChartModule ], // ... })Vue
React
import React from 'react'; import Chart, { Series } from 'devextreme-react/chart';
class App extends React.Component { render() { return (
export default App;
If all panes in a multi-pane chart should have uniform settings, you can specify them in the commonPaneSettings object.
jQuery
$(function() {
$("#chartContainer").dxChart({
// ...
commonPaneSettings: {
backgroundColor: 'yellow',
border: {
visible: true,
width: 2
}
}
});
});Angular
<dx-chart ... >
<dxo-chart-common-pane-settings
backgroundColor="yellow">
<dxo-chart-border
[visible]="true"
[width]="2">
</dxo-chart-border>
</dxo-chart-common-pane-settings>
</dx-chart>
import { DxChartModule } from "devextreme-angular";
// ...
export class AppComponent {
    // ...
}
@NgModule({
    imports: [
        // ...
        DxChartModule
    ],
    // ...
})
Vue
<template>
    <DxChart ... >
        <DxCommonPaneSettings background-color="yellow">
            <DxBorder
                :visible="true"
                :width="2"
            />
        </DxCommonPaneSettings>
    </DxChart>
</template>

<script>
import DxChart, {
    DxCommonPaneSettings,
    DxBorder
} from 'devextreme-vue/chart';

export default {
    components: {
        DxChart,
        DxCommonPaneSettings,
        DxBorder
    }
}
</script>
React
import React from 'react';
import Chart, {
    CommonPaneSettings,
    Border
} from 'devextreme-react/chart';

class App extends React.Component {
    render() {
        return (
            <Chart ... >
                <CommonPaneSettings backgroundColor="yellow">
                    <Border
                        visible={true}
                        width={2}
                    />
                </CommonPaneSettings>
            </Chart>
        );
    }
}

export default App;See Also

 Select one or more answers