Vue Chart - Error Bars
Error bars are used on charts to indicate an error or uncertainty in a reported measurement. They give a general idea of how precise the measurement is.
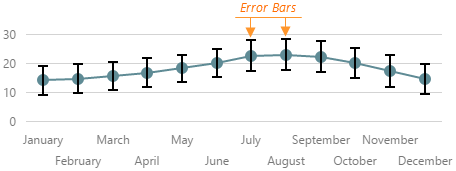
Error bars can be generated either from concrete or calculated values. To generate one error bar, two values, high and low, are needed. If your data source provides concrete high and low values, assign the required data source fields to the highValueField and lowValueField properties of the series.valueErrorBar object.
jQuery
$(function() {
    $("#chartContainer").dxChart({
        // ...
        dataSource: [
            { arg: 1, val: 200, highError: 5, lowError: 3 },
            // ...
        ],
        series: {
            // ...
            valueErrorBar: {
                highValueField: 'highError',
                lowValueField: 'lowError'
            }
        }
    });
});
Angular
<dx-chart [dataSource]="chartDataSource">
    <dxi-chart-series ... >
        <dxo-chart-value-error-bar
            highValueField="highError"
            lowValueField="lowError">
        </dxo-chart-value-error-bar>
    </dxi-chart-series>
</dx-chart>
import { DxChartModule } from "devextreme-angular";
// ...
export class AppComponent {
    chartDataSource = [
        { arg: 1, val: 200, highError: 5, lowError: 3 },
        // ...
    ]
}
@NgModule({
    imports: [
        // ...
        DxChartModule
    ],
    // ...
})
Vue
<template>
    <DxChart
        :data-source="chartDataSource"
        ...
    >
        <DxSeries ... >
            <DxValueErrorBar
                high-value-field="highError"
                low-value-field="lowError"
            />
        </DxSeries>
    </DxChart>
</template>

<script>
import DxChart, {
    DxSeries,
    DxValueErrorBar
} from 'devextreme-vue/chart';

export default {
    components: {
        DxChart,
        DxSeries,
        DxValueErrorBar
    },
    data() {
        return {
            chartDataSource: [
                { arg: 1, val: 200, highError: 5, lowError: 3 },
                // ...
            ]
        };
    }
}
</script>
React
import React from 'react';
import Chart, {
    Series,
    ValueErrorBar
} from 'devextreme-react/chart';

const chartDataSource = [
    { arg: 1, val: 200, highError: 5, lowError: 3 },
    // ...
];

export default function App() {
    return (
        <Chart
            dataSource={chartDataSource}
            ...
        >
            <Series ... >
                <ValueErrorBar
                    highValueField="highError"
                    lowValueField="lowError"
                />
            </Series>
        </Chart>
    );
}
Alternatively, error bar values can be calculated according to an algorithm. In this case, choose the needed algorithm using the type property and specify the value to be used in calculation using the value property.
jQuery
$(function() {
    $("#chartContainer").dxChart({
        // ...
        series: {
            // ...
            valueErrorBar: {
                type: 'percent',
                value: 5
            }
        }
    });
});
Angular
<dx-chart ... >
    <dxi-chart-series ... >
        <dxo-chart-value-error-bar
            type="percent"
            [value]="5">
        </dxo-chart-value-error-bar>
    </dxi-chart-series>
</dx-chart>
import { DxChartModule } from "devextreme-angular";
// ...
export class AppComponent {
    // ...
}
@NgModule({
    imports: [
        // ...
        DxChartModule
    ],
    // ...
})
Vue
<template>
    <DxChart ... >
        <DxSeries ... >
            <DxValueErrorBar
                :value="5"
                type="percent"
            />
        </DxSeries>
    </DxChart>
</template>

<script>
import DxChart, {
    DxSeries,
    DxValueErrorBar
} from 'devextreme-vue/chart';

export default {
    components: {
        DxChart,
        DxSeries,
        DxValueErrorBar
    }
}
</script>
React
import React from 'react';
import Chart, {
    Series,
    ValueErrorBar
} from 'devextreme-react/chart';

export default function App() {
    return (
        <Chart ... >
            <Series ... >
                <ValueErrorBar
                    value={5}
                    type="percent"
                />
            </Series>
        </Chart>
    );
}
If error bars should have uniform settings, you can specify them using one of the commonSeriesSettings.valueErrorBar object. Individual series settings override common settings.
jQuery
$(function() {
    $("#chartContainer").dxChart({
        // ...
        series: {
            valueErrorBar: {
                // high priority
            }
        },
        commonSeriesSettings: {
            valueErrorBar: {
                // low priority
            }
        }
    });
});
Angular
<dx-chart ... >
    <dxi-chart-series>
        <dxo-chart-value-error-bar>
            <!-- high priority -->
        </dxo-chart-value-error-bar>
    </dxi-chart-series>
    <dxo-chart-common-series-settings>
        <dxo-chart-value-error-bar>
            <!-- low priority -->
        </dxo-chart-value-error-bar>
    </dxo-chart-common-series-settings>
</dx-chart>
import { DxChartModule } from "devextreme-angular";
// ...
export class AppComponent {
    // ...
}
@NgModule({
    imports: [
        // ...
        DxChartModule
    ],
    // ...
})
Vue
<template>
    <DxChart ... >
        <DxSeries ... >
            <DxValueErrorBar ... >
                <!-- high priority -->
            </DxValueErrorBar>
        </DxSeries>

        <DxCommonSeriesSettings ... >
            <DxValueErrorBar ... >
                <!-- low priority -->
            </DxValueErrorBar>
        </DxCommonSeriesSettings>
    </DxChart>
</template>

<script>
import DxChart, {
    DxSeries,
    DxCommonSeriesSettings,
    DxValueErrorBar
} from 'devextreme-vue/chart';

export default {
    components: {
        DxChart,
        DxSeries,
        DxCommonSeriesSettings,
        DxValueErrorBar
    }
}
</script>
React
import React from 'react';
import Chart, {
    Series,
    CommonSeriesSettings,
    ValueErrorBar
} from 'devextreme-react/chart';

export default function App() {
    return (
        <Chart ... >
            <Series ... >
                <ValueErrorBar ... >
                    {/* high priority */}
                </ValueErrorBar>
            </Series>

            <CommonSeriesSettings ... >
                <ValueErrorBar ... >
                    {/* low priority */}
                </ValueErrorBar>
            </CommonSeriesSettings>
        </Chart>
    );
}
For information about all properties of the error bars, visit the valueErrorBar section of the API reference.

 Select one or more answers