JavaScript/jQuery Chart - valueAxis.breaks
Declares a custom scale break collection. Applies only if the axis' type is "continuous" or "logarithmic".
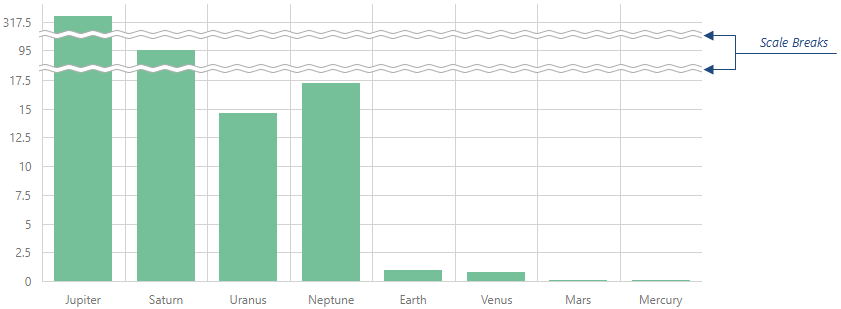
A scale break is an area across an axis that is displayed instead of a section of an axis range. Scale breaks improve the readability of chart sections with large gaps in their ranges.

Each object in the breaks array configures a single scale break. A scale break range should be at least two tick intervals. Otherwise, the scale break might not be visible.
See Also

 Select one or more answers