JavaScript/jQuery Chart - valueAxis.tick
Configures major axis tick appearance.
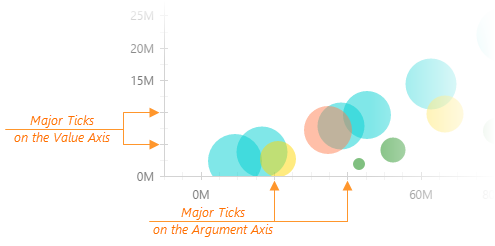
Ticks help you align values with their corresponding data points on an axis. The tick object configures major ticks that are placed in relation to value labels.
jQuery
$('#chart').dxChart({
    commonAxisSettings: {
        tick: {
            visible: true,
            color: "blue",
            length: 20,
            opacity: 0.75,
            shift: 0,
            width: 2,
        },
    },
})
Angular
<dx-chart ... >
    <dxo-chart-common-axis-settings>
        <dxo-chart-tick
            [visible]="true"
            color="blue"
            [length]="20"
            [opacity]="0.75"
            [shift]="0"
            [width]="2"
        ></dxo-chart-tick>
    </dxo-chart-common-axis-settings>
</dx-chart>
Vue
<template>
    <DxChart ... >
        <DxCommonAxisSettings>
            <DxTick
                :visible="true"
                color="blue"
                :length="20"
                :opacity="0.75"
                :shift="0"
                :width="2"
            />
        </DxCommonAxisSettings>
    </DxChart>
</template>

<script setup lang="ts">
import { DxChart, DxCommonAxisSettings, DxTick } from 'devextreme-vue/chart';

</script>
React
import { Chart, CommonAxisSettings, Tick } from 'devextreme-react/chart';

function App() {
    return (
        <Chart ... >
            <CommonAxisSettings>
                <Tick
                    visible={true}
                    color="blue"
                    length={20}
                    opacity={0.75}
                    shift={0}
                    width={2}
                />
            </CommonAxisSettings>
        </Chart>
    )
}
The commonAxisSettings.tick object specifies common settings for all major ticks in a chart. To configure only those major ticks that belong to a particular axis, use the following objects:
Axis-specific settings override common settings.
See Also
- argumentAxis.tickInterval - specifies the tick interval of the argument axis.
- valueAxis.tickInterval - specifies the tick interval of the value axis.
- commonAxisSettings.minorTick - customizes minor tick appearance.
color
Specifies the color of ticks.
This property supports the following colors:
- Hexadecimal colors
- RGB colors
- RGBA colors
- Predefined/cross-browser color names
- Predefined SVG colors
- Paint server address
opacity
Specifies how transparent ticks should be.
This property accepts a value from 0 to 1, where 0 makes ticks completely transparent, and 1 makes them opaque.
shift
Shifts ticks from the reference position.
In the reference position, the axis runs through the center of each tick:
Positive values shift ticks toward axis labels; negative values shift ticks in the opposite direction.
The following table illustrates this property:
| Shift Value | Horizontal Axis | Vertical Axis |
|---|---|---|
shift: 3 |
 |
 |
shift: -3 |
 |
 |

 Select one or more answers