JavaScript/jQuery Chart - Constant Lines
A constant line is a straight line that extends over the entire Chart and indicates an axis value. Constant lines are always perpendicular to the axis to which they belong.
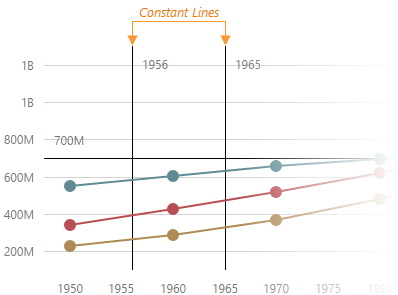
To configure the constant lines, declare the constantLines array in the argumentAxis or valueAxis object. This array should contain objects, and each one of them configures a single constant line. A constant line demands at least the value property to be set.
jQuery
$(function() {
    $("#chartContainer").dxChart({
        // ...
        argumentAxis: {
            constantLines: [
                { value: 100 },
                { value: 50 }
            ]
        },
        valueAxis: {
            constantLines: [
                { value: 40 },
                { value: 70 }
            ]
        }
    });
});
Angular
<dx-chart ... >
    <dxo-chart-argument-axis>
        <dxi-chart-constant-line [value]="100"></dxi-chart-constant-line>
        <dxi-chart-constant-line [value]="50"></dxi-chart-constant-line>
    </dxo-chart-argument-axis>
    <dxi-chart-value-axis>
        <dxi-chart-constant-line [value]="40"></dxi-chart-constant-line>
        <dxi-chart-constant-line [value]="70"></dxi-chart-constant-line>
    </dxi-chart-value-axis>
</dx-chart>
import { DxChartModule } from "devextreme-angular";
// ...
export class AppComponent {
    // ...
}
@NgModule({
    imports: [
        // ...
        DxChartModule
    ],
    // ...
})
Vue
<template>
    <DxChart ... >
        <DxArgumentAxis>
            <DxConstantLine :value="100"/>
            <DxConstantLine :value="50"/>
        </DxArgumentAxis>
        <DxValueAxis>
            <DxConstantLine :value="40"/>
            <DxConstantLine :value="70"/>
        </DxValueAxis>
    </DxChart>
</template>

<script>
import DxChart, {
    DxArgumentAxis,
    DxValueAxis,
    DxConstantLine
} from 'devextreme-vue/chart';

export default {
    components: {
        DxChart,
        DxArgumentAxis,
        DxValueAxis,
        DxConstantLine
    }
}
</script>
React
import React from 'react';
import Chart, {
    ArgumentAxis,
    ValueAxis,
    ConstantLine
} from 'devextreme-react/chart';

class App extends React.Component {
    render() {
        return (
            <Chart ... >
                <ArgumentAxis>
                    <ConstantLine value={100}/>
                    <ConstantLine value={50}/>
                </ArgumentAxis>
                <ValueAxis>
                    <ConstantLine value={40}/>
                    <ConstantLine value={70}/>
                </ValueAxis>
            </Chart>
        );
    }
}

export default App;
If several constant lines should have a uniform style, you can specify it using one of the following objects.
argumentAxis.constantLineStyle
Style for constant lines belonging to the argument axis.valueAxis.constantLineStyle
Style for constant lines belonging to the value axis.commonAxisSettings.constantLineStyle
Style for all constant lines in the Chart.
Note that individual settings override axis-specific settings which, in turn, override common settings.
jQuery
$(function() {
    $("#chartContainer").dxChart({
        // ...
        argumentAxis: {
            constantLines: [
                // high priority
            ],
            constantLineStyle: {
                // middle priority
            }
        },
        valueAxis: {
            constantLines: [
                // high priority
            ],
            constantLineStyle: {
                // middle priority
            }
        },
        commonAxisSettings: {
            constantLineStyle: {
                // low priority
            }
        }
    });
});
Angular
<dx-chart ... >
    <dxo-chart-argument-axis>
        <dxi-chart-constant-line ... >
            <!-- high priority -->
        </dxi-chart-constant-line>
        <dxo-chart-constant-line-style ... >
            <!-- middle priority -->
        </dxo-chart-constant-line-style>
    </dxo-chart-argument-axis>
    <dxi-chart-value-axis>
        <dxi-chart-constant-line ... >
            <!-- high priority -->
        </dxi-chart-constant-line>
        <dxo-chart-constant-line-style ... >
            <!-- middle priority -->
        </dxo-chart-constant-line-style>
    </dxi-chart-value-axis>
    <dxo-chart-common-axis-settings>
        <dxo-chart-constant-line-style ... >
            <!-- low priority -->
        </dxo-chart-constant-line-style>
    </dxo-chart-common-axis-settings>
</dx-chart>
import { DxChartModule } from "devextreme-angular";
// ...
export class AppComponent {
    // ...
}
@NgModule({
    imports: [
        // ...
        DxChartModule
    ],
    // ...
})
Vue
<template>
    <DxChart ... >
        <DxArgumentAxis ... >
            <DxConstantLine ... >
                <!-- high priority -->
            </DxConstantLine>
            <DxConstantLineStyle ... >
                <!-- middle priority -->
            </DxConstantLineStyle>
        </DxArgumentAxis>
        <DxValueAxis ... >
            <DxConstantLine ... >
                <!-- high priority -->
            </DxConstantLine>
            <DxConstantLineStyle ... >
                <!-- middle priority -->
            </DxConstantLineStyle>
        </DxValueAxis>
        <DxCommonAxisSettings>
            <DxConstantLineStyle ... >
                <!-- low priority -->
            </DxConstantLineStyle>
        </DxCommonAxisSettings>
    </DxChart>
</template>

<script>
import DxChart, {
    DxCommonAxisSettings,
    DxArgumentAxis,
    DxValueAxis,
    DxConstantLine,
    DxConstantLineStyle
} from 'devextreme-vue/chart';

export default {
    components: {
        DxChart,
        DxCommonAxisSettings,
        DxArgumentAxis,
        DxValueAxis,
        DxConstantLine,
        DxConstantLineStyle
    }
}
</script>
React
import React from 'react';
import Chart, {
    CommonAxisSettings,
    ArgumentAxis,
    ValueAxis,
    ConstantLine,
    ConstantLineStyle
} from 'devextreme-react/chart';

class App extends React.Component {
    render() {
        return (
            <Chart ... >
                <ArgumentAxis ... >
                    <ConstantLine ... >
                        {/* high priority */}
                    </ConstantLine>
                    <ConstantLineStyle ... >
                        {/* middle priority */}
                    </ConstantLineStyle>
                </ArgumentAxis>
                <ValueAxis ... >
                    <ConstantLine ... >
                        {/* high priority */}
                    </ConstantLine>
                    <ConstantLineStyle ... >
                        {/* middle priority */}
                    </ConstantLineStyle>
                </ValueAxis>
                <CommonAxisSettings>
                    <ConstantLineStyle ... >
                        {/* low priority */}
                    </ConstantLineStyle>
                </CommonAxisSettings>
            </Chart>
        );
    }
}

export default App;
For information about all properties of the constant lines, visit the constantLines section of the API reference.
See Also

 Select one or more answers