JavaScript/jQuery Chart - Color Gradients and Patterns
To change series color, use one of the following options:
- Specify a color palette for the component.
- Specify a color for a series.
- Specify a color for all series.
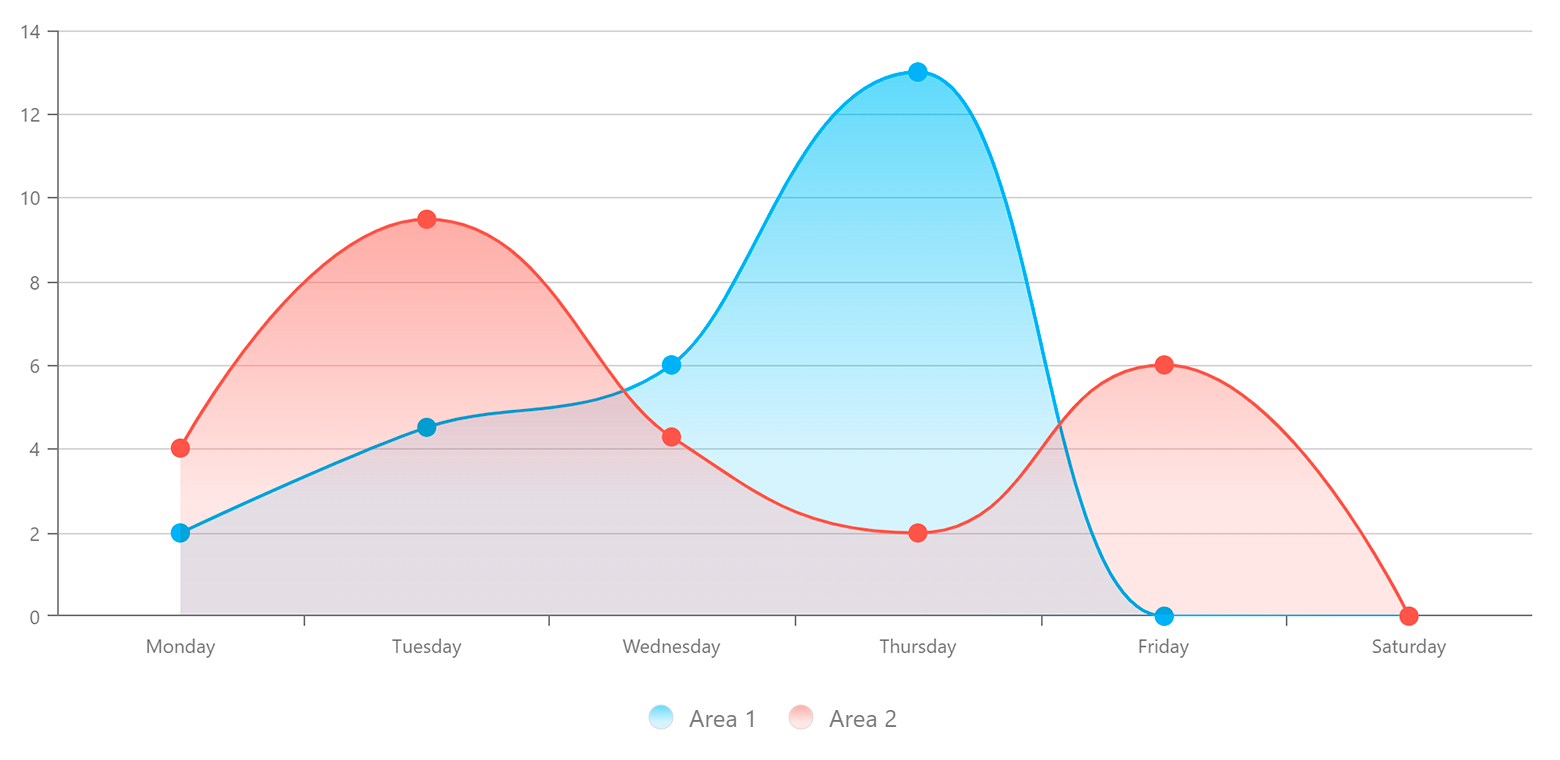
Besides color change, you can add a custom pattern or gradient fill to the following series:
- Area
- Stacked area
- Full-stacked area
- Spline area
- Stacked spline area
- Full-stacked spline area
- Range area
- Step area
- Bar
- Stacked bar
- Full-stacked bar
- Range bar
- Bubble
Use the registerPattern() or registerGradient() method to create a custom pattern or gradient.
The following example adds a gradient to all series in a Chart:
jQuery
index.js
const registerGradient = DevExpress.common.charts.registerGradient;

$(() => {
    $('#chart').dxChart({
        // ...
        commonSeriesSettings: {
            color: {
                base: "#f5564a",
                fillId: registerGradient("linear", {
                    colors: [{
                        offset: "20%",
                        color: "#97c95c"
                    }, {
                        offset: "90%",
                        color: "#eb3573"
                    }]
                })
            }
        }
    });
});
Angular
app.component.html
app.component.ts
<dx-chart ... >
    <dxo-chart-common-series-settings [color]="seriesColor">
    </dxo-chart-common-series-settings>
</dx-chart>
import { registerGradient } from "devextreme/common/charts";

export class AppComponent {
    seriesColor = {
        base: "#f5564a",
        fillId: registerGradient("linear", {
            colors: [{
                offset: "20%",
                color: "#97c95c"
            }, {
                offset: "90%",
                color: "#eb3573"
            }]
        });
    };
}
Vue
App.vue (Options API)
App.vue (Composition API)
<template>
    <DxChart ... >
        <DxCommonSeriesSettings
            :color="seriesColor"
        />
    </DxChart>
</template>
<script>
    import DxChart, { DxCommonSeriesSettings } from 'devextreme-vue/chart';
    import { registerGradient } from 'devextreme/common/charts';

    export default {
        components: {
            DxChart,
            DxCommonSeriesSettings
        },
        data() {
            return {
                // ...
                seriesColor: {
                    base: '#f5564a',
                    fillId: registerGradient("linear", {
                        colors: [{
                            offset: "20%",
                            color: "#97c95c"
                        }, {
                            offset: "90%",
                            color: "#eb3573"
                        }]
                    })
                }
            }
        }
    };
</script>
<template>
    <DxChart ... >
        <DxCommonSeriesSettings
            :color="seriesColor"
        />
    </DxChart>
</template>
<script setup>
    import DxChart, { DxCommonSeriesSettings } from 'devextreme-vue/chart';
    import { registerGradient } from 'devextreme/common/charts';

    // ...

    const seriesColor = {
        base: '#f5564a',
        fillId: registerGradient("linear", {
            colors: [{
                offset: "20%",
                color: "#97c95c"
            }, {
                offset: "90%",
                color: "#eb3573"
            }]
        })
    };
</script>
React
App.js
import Chart, { CommonSeriesSettings } from 'devextreme-react/chart';
import { registerGradient } from 'devextreme/common/charts';

const seriesColor = {
    base: "#f5564a",
    fillId: registerGradient("linear", {
        colors: [{
            offset: "20%",
            color: "#97c95c"
        }, {
            offset: "90%",
            color: "#eb3573"
        }]
    })
};

export default function App() {
    return (
        <Chart ... >
            <CommonSeriesSettings
                color={seriesColor}
            />
        </Chart>
    );
}
 Select one or more answers