Chart - Series Points Overview
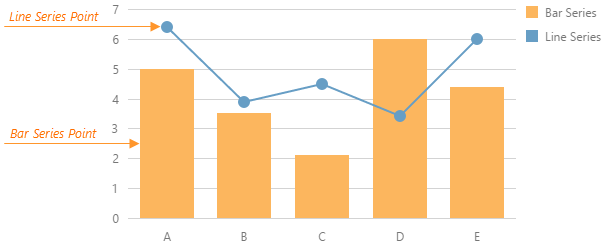
A series point is a visual representation of one or several data objects. Series points can have different shapes and sizes depending on the series types.
For those series whose points are simple dots (Range Area and Scatter, all line and area series), point-related settings are collected in the point object. This object can be declared as follows.
jQuery
$(function() {
    $("#chartContainer").dxChart({
        // ...
        series: [{
            point: {
                // Settings for all points of an individual series
            }
        }, {
            // ...
        }],
        commonSeriesSettings: {
            point: {
                // Settings for all points of all series
            }
        }
    });
});
Angular
<dx-chart ... >
    <dxi-chart-series>
        <dxo-chart-point ... >
            <!-- Settings for all points of an individual series -->
        </dxo-chart-point>
    </dxi-chart-series>
    <dxo-chart-common-series-settings ... >
        <dxo-chart-point ... >
            <!-- Settings for all points of all series -->
        </dxo-chart-point>
    </dxo-chart-common-series-settings>
</dx-chart>
import { DxChartModule } from "devextreme-angular";
// ...
export class AppComponent {
    // ...
}
@NgModule({
    imports: [
        // ...
        DxChartModule
    ],
    // ...
})
Vue
<template>
    <DxChart ... >
        <DxSeries>
            <DxPoint ... >
                <!-- Settings for all points of an individual series -->
            </DxPoint>
        </DxSeries>
        <DxCommonSeriesSettings ... >
            <DxPoint ... >
                <!-- Settings for all points of all series -->
            </DxPoint>
        </DxCommonSeriesSettings>
    </DxChart>
</template>

<script>
import DxChart, {
    DxCommonSeriesSettings,
    DxSeries,
    DxPoint
} from 'devextreme-vue/chart';

export default {
    components: {
        DxChart,
        DxCommonSeriesSettings,
        DxSeries,
        DxPoint
    }
}
</script>
React
import React from 'react';
import Chart, {
    CommonSeriesSettings,
    Series,
    Point
} from 'devextreme-react/chart';

class App extends React.Component {
    render() {
        return (
            <Chart ... >
                <Series>
                    <Point ... >
                        {/* Settings for all points of an individual series */}
                    </Point>
                </Series>
                <CommonSeriesSettings ... >
                    <Point ... >
                        {/* Settings for all points of all series */}
                    </Point>
                </CommonSeriesSettings>
            </Chart>
        );
    }
}

export default App;
A dedicated object is not provided for series whose points have a distinctive appearance (Range Bar and Bubble, all bar and financial series), and all point-related settings are declared directly in the series or commonSeriesSettings object. Refer to the description of a particular series type in the Series Types section of the API reference for more details on the available settings.
Settings specified in the manner described above apply to a congregation of series points. If you need to customize an individual point, assign a function to the customizePoint property. This function must return an object with properties for the point that you want to customize.
jQuery
$(function() {
    $("#chartContainer").dxChart({
        // ...
        series: {
            point: {
                color: 'blue'
            }
        },
        // Assigns the red color to all series points with value more than 100
        // Other series points remain painted in blue
        customizePoint: function (pointInfo) {
            return pointInfo.value > 100 ? { color: 'red' } : { }
        }
    });
});
Angular
<dx-chart
    [customizePoint]="customizePoint">
    <dxi-chart-series>
        <dxo-chart-point color="blue" ></dxo-chart-point>
    </dxi-chart-series>
</dx-chart>
import { DxChartModule } from "devextreme-angular";
// ...
export class AppComponent {
    // Assigns the red color to all series points with value more than 100
    // Other series points remain painted in blue
    customizePoint (pointInfo: any) {
        return pointInfo.value > 100 ? { color: 'red' } : { }
    };
}
@NgModule({
    imports: [
        // ...
        DxChartModule
    ],
    // ...
})
Vue
<template>
    <DxChart
        :customize-point="customizePoint"
        ...
    >
        <DxSeries>
            <DxPoint color="blue"/>
        </DxSeries>
    </DxChart>
</template>

<script>
import DxChart, {
    DxSeries,
    DxPoint
} from 'devextreme-vue/chart';

export default {
    components: {
        DxChart,
        DxSeries,
        DxPoint
    },
    methods: {
        // Assigns the red color to all series points with value more than 100
        // Other series points remain painted in blue
        customizePoint (pointInfo: any) {
            return pointInfo.value > 100 ? { color: 'red' } : { }
        }
    }
}
</script>
React
import React from 'react';
import Chart, {
    Series,
    Point
} from 'devextreme-react/chart';

class App extends React.Component {
    render() {
        return (
            <Chart
                customizePoint={this.customizePoint}
                ...
            >
                <Series>
                    <Point color="blue" />
                </Series>
            </Chart>
        );
    }

    // Assigns the red color to all series points with value more than 100
    // Other series points remain painted in blue
    customizePoint (pointInfo: any) {
        return pointInfo.value > 100 ? { color: 'red' } : { }
    }
}

export default App;See Also

 Select one or more answers