JavaScript Charts
Everything You'll Need
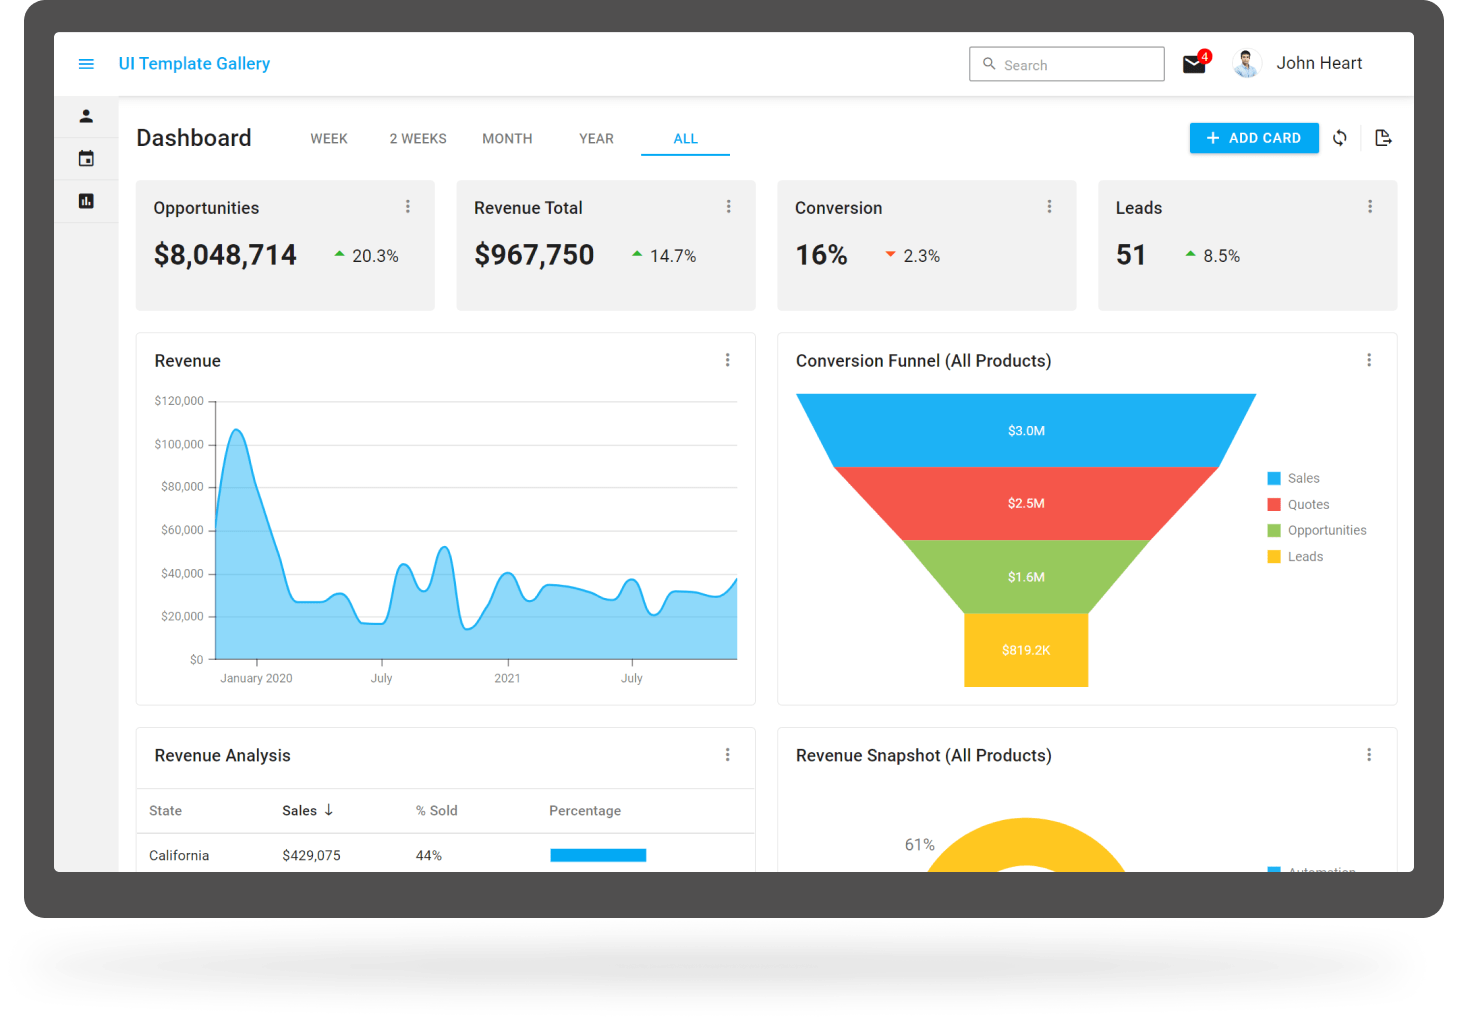
Our JavaScript data visualization components allow you to transform data into its most appropriate, concise, and readable visual representation. DevExtreme’s chart, gauge and range selector components can be used together to create informative dashboards that effectively convey business information at a single glance.
30 Chart Types
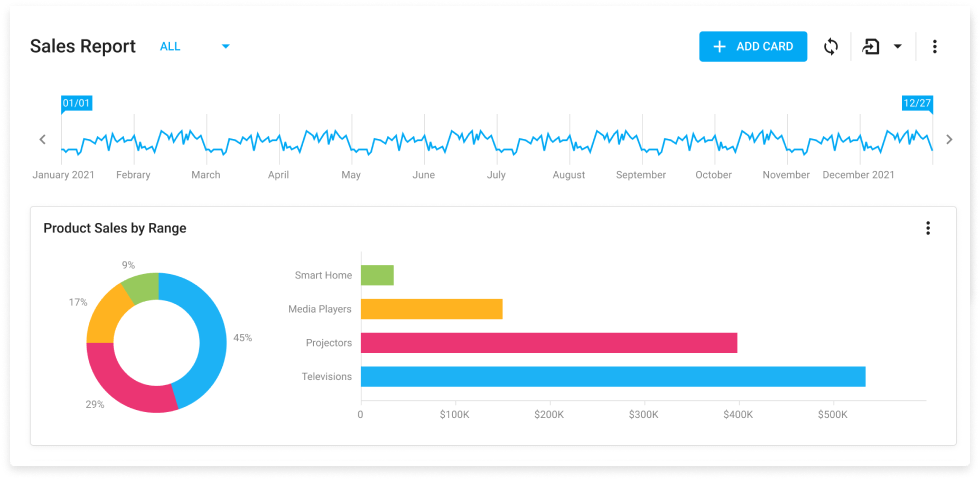
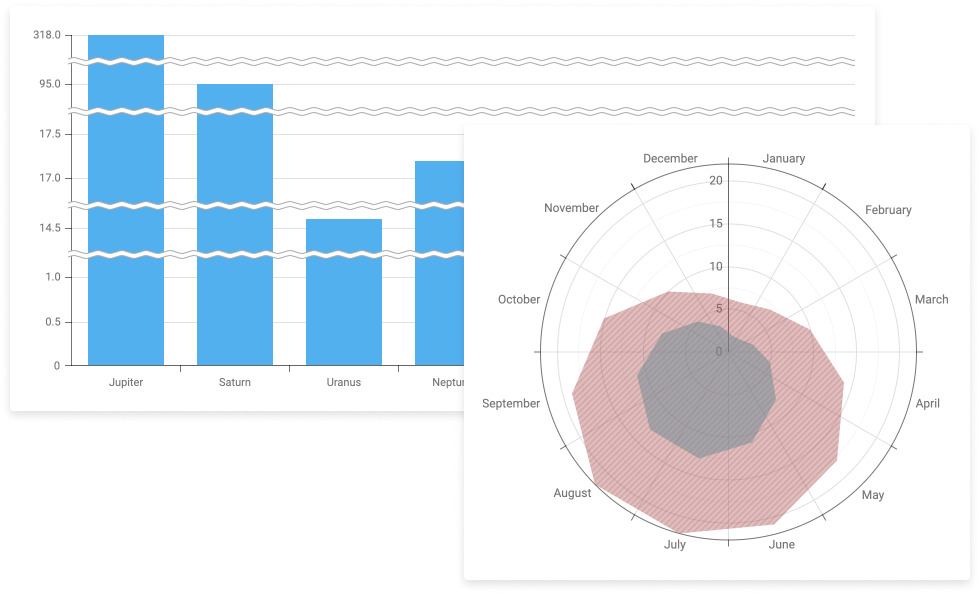
DevExtreme JavaScript Chart components will help you deliver sophisticated analytics dashboards, with visualization options for a variety of datasets/information stores. The suite includes everything from bar, line and area series, to advanced polar, bubble or funnel charts. And if your app targets the financial sector, our candle stick chart will help you visualize real-time stock/financial data with ease.
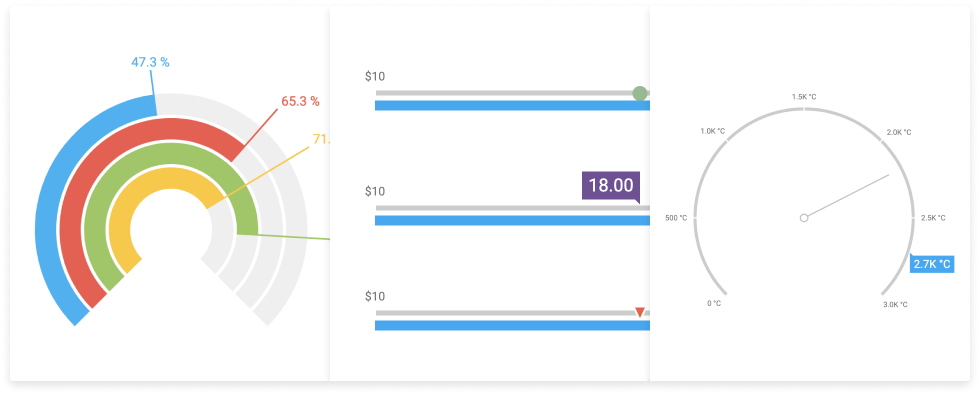
3 Gauge Types
Our JavaScript Gauge component library includes three distinct gauge types (circular, radial, and linear). When used in conjunction with DevExtreme Charts, our JavaScript Gauge component can help you deliver highly refined user experiences for a variety of business scenarios.
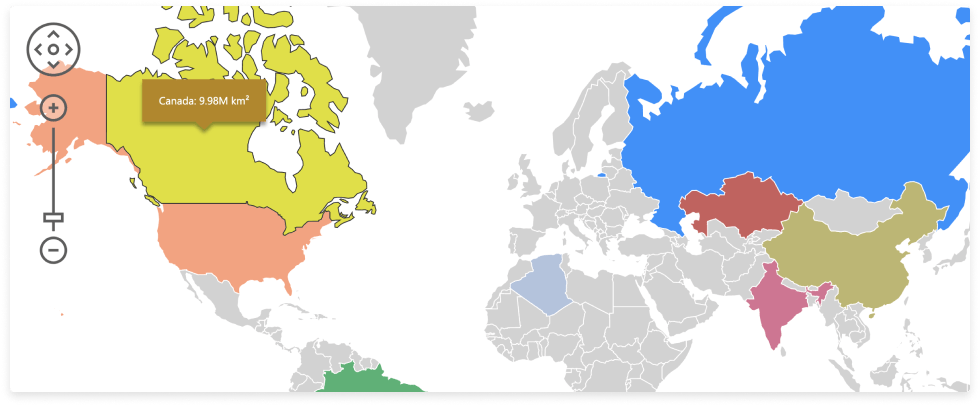
Vector Map Component
The DevExtreme JavaScript Vector Map Component allows you to incorporate interactive mapping capabilities into any JavaScript-based web app. Our Map component can highlight key map locations via markers. You can customize areas and markers to your own requirements. This component ships with a client API to handle hover, click and selection operations for both areas and markers.
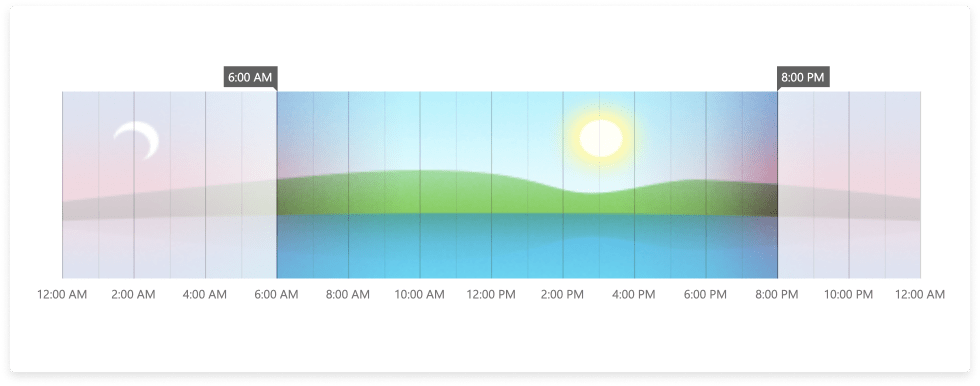
Interactive Range Selector Component
Our JavaScript Range Selector Component allows you to specify a range using either date/time or numeric scales. To simplify use, scale type is auto-generated based (based on your data source). Options include the ability to display major and minor tick marks, display background colors, images, or even a chart. Extended features include the ability to move sliders via a pointing device or by touch. You can also bind the Range Selector to our Chart component to enable zoom/scroll operations.
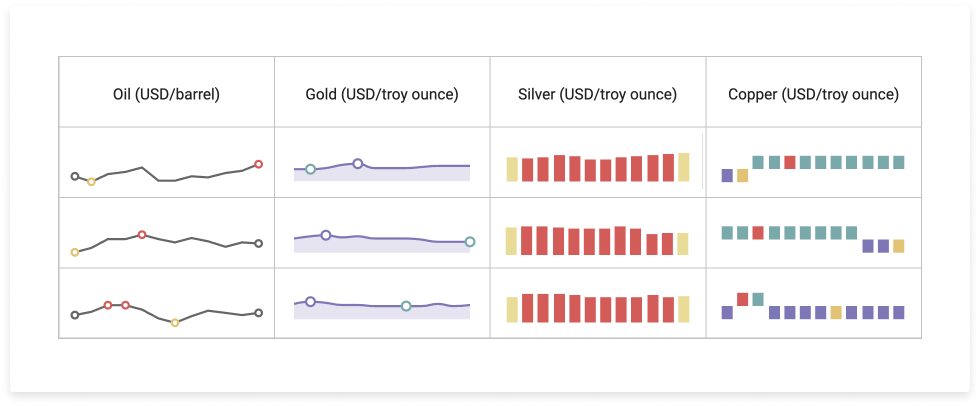
4 Sparkline Types
DevExtreme ships with 4 JavaScript Sparkline types. You can display a sparkline within a specific page region or inside individual Data Grid cells.
Your Next Great App
Starts Here
30 Day Trial
Download our fully functional 30-day trial. Registration not required.
60-Day Money Back Guarantee
Buy with confidence. All DevExpress products come with a 60-day money back guarantee.
Tiered Discounts
Save money and add licenses as organizational/growth needs dictate.
When Only the Best Will Do
Trusted by engineers throughout the world – Your Next Great App Starts Here

Great tool!! Thanks very much for the great work We use your JS product set in our React frontends We love your products!
Daniel Buys
TallOrder, South Africa
The DevExtreme controls are excellent, just keep improving and adding to them. Also, the MCP server is a game changer. I can describe to Copilot what I want and it picks and programs the correct DevExtreme controls. I've been able to produce much better apps using it.
Damien Bhanji
United Kingdom

ASP.NET Core Data Grid is the most used component for me. I am very happy with the quality of the products and with the support.
Spyridon Klonis
Server Solutions LTD, Greece
I really appreciate the development done with DevExtreme (jQuery for now for me), the numerous demos that inspire me, and the numerous demos that allow me to visualize the possibilities. This was one of my criteria for choosing you, and I'm not disappointed, far from it. Especially since the documentation provided allows AI to help me considerably, which is a real plus. I'm in the process of transforming an application created with Splitters to a smartphone, and so I switched to DxResponsiveBox in this case. It seems to be going well, but I admit that an example, a demo in terms of usability would have been very helpful. And then some ideas for making it a real Android or iPhone app (I'll rely on AI for this to save time in discovering solutions). Here's an idea for an additional demo :-)
Philippe Pierre
France

We use DevExtreme JS for all of our Web and PWA applications. We are very satisfied since the beginning of our subscription. Online documentation is awesome and easy to use. JS Widgets are fast and easy to integrate. Keep up the good work.
Michel Savard
Lafleur Industrial Garage Doors , Canada

I love your solutions. Anytime I have the opportunity to work with DevExtreme, I'm a happy coder. The out-of-the-box functionality is top-notch and allows developers to focus on the aspects of their app that distinguish themselves instead of spending countless hours re-inventing the wheel, so to speak.
Jake Smith
United States of America
I have been working with DevExpress components for more than 10 years and I have no complaints about the functionalities, the provision of new versions and the speed of answers to questions. Keep up the good work and be among the best.
Atanas Tinkin
AT Software Applications EOOD, Bulgaria

I use Desktop UI Components (winforms), JS Components (jQuery), ASP.NET MVC / WEBFORMS, Reporting & Analytics, Cross-platform .NET, Mobile UI (next year). Using the DevExpress platform meets all my expectations, both in terms of ease of use of all the features with extensive documentation and in the speed of developing solutions tailored to my customers. And thank you for making my job easier.

Marcos Romero
DigitalRoots, Brazil
I am amazed at how good and knowledgeable the folks at DevExpress are! I totally love your product and the support you are providing and have been providing so far. Your product is not the only product that I was lucky to work with. You guys ROCK!
Vladimir Moldovan
NYC Department of Youth & Community Development
I develop my systems (ERP) on top of a French language (windev/pcsoft), which has as its main problem the frontend, the combination of devexpress+windev was something that gave me a final result above expectations, for that I developed N classes where I can create the components entirely through friendly parameters, in addition to customization and access to methods and events, DevExpress allowed me to have the best of 2 worlds within the same development structure.
Paulo Viana Sousa
Brazil
I use DevExtreme for Angular - DataGrids, Trees, Gantt, Diagram, Forms and controls; Reporting and PDF creation. Office API DevExpress is the best in the market and makes our software look and work amazingly well.
Gerard Hart
Australia
I use the Domapi library which disappeared from the market several years ago. I complemented it with various libraries and bookstores like datatable, fancytree, chartdirector, crop js and many others like yui. I have been using DevExtreme for some time and I have decided to gradually replace all these controls with yours and to integrate new ones like the gantt, the calendar etc. The flexibility of integration and the power obtained makes you want :-) I spent a lot of time on the demos and that was enough to convince me. The price being reasonable, I'm going for it.
Philippe Pierre
France

I use XAF and DevExtreme in most cases. It is a really good product and helps us a lot on a daily basis.

Felippe Domingos
Actiz, Brazil
We use DevExtreme for a business workflow application. DevExtreme provides a huge and powerful set of Widgets that speeds up our development a lot!
Sven Dröge
Germany
DevExtreme helps simplify system implementation. It's a good product, and the documents are great as well.
Jaeyoung Kim
Republic of Korea

Very good documentation and very well designed controls. We are very happy and will continue to use these tools. Thanks!
Huascar Ramirez Angeles
WPMOVIL CLOUD, Spain
React DevExtreme controls. High satisfaction.
Elliot Lirz
United States of America
I use grid, charts, forms for .NET and Angular. Very satisfied.
Krešimir Jušinski
Croatia
I use Blazor, DevExtreme. Pretty good. You guys are better than most.
Robert Dytmire
United States of America
Great Software and great support. I cannot expect anything better.
Lluis Trincado
Spain
Guaranteed response within a day. Always helpful. Great product.
Daniel Simonavicius
Ireland
We love the DevExpress tools for our HRMS application development and we value the customer support system provided by the team.
Sarathlal Saseendran
Voyon Technology Services Pvt Ltd.
Special holiday thanks for the support team that puts the + in the A+ rating for Dev Express tools. A tool is only as good as the support behind it.
James Mayer
United States of America
DevExtreme. I have been using DevExpress professionally for almost 17 years. Top-notch, hands down, best dev tools out there!
Jay Stratemeyer
United States of America
Need UI Components for a Different Framework?
DevExtreme includes 80+ UI components for the following development frameworks.