React Chart - Multi-Axis Chart
A multi-axis chart adds extra meanings to visualized data in comparison to a single-axis chart. For example, in a single-axis chart, you have to choose which values to indicate - absolute or percentage. With a multi-axis chart, you are free to indicate both absolute and percentage values on two separate axis.
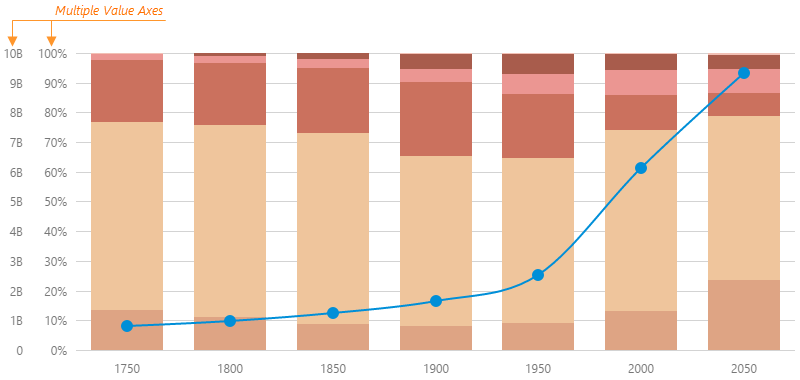
To configure a multi-axis chart, follow the steps below.
Create and name the value axes
Declare several objects in the valueAxis array. Each object configures a single value axis. Then, give each value axis a unique name.jQuery
JavaScript$(function() { $("#chartContainer").dxChart({ // ... valueAxis: [{ name: 'absoluteAxis' }, { name: 'percentageAxis' }] }); });Angular
HTMLTypeScript<dx-chart ... > <dxi-chart-value-axis name="absoluteAxis"></dxi-chart-value-axis> <dxi-chart-value-axis name="percentageAxis"></dxi-chart-value-axis> </dx-chart>import { DxChartModule } from "devextreme-angular"; // ... export class AppComponent { // ... } @NgModule({ imports: [ // ... DxChartModule ], // ... })Vue
App.vue<template> <DxChart ... > <DxValueAxis name="absoluteAxis"/> <DxValueAxis name="percentageAxis"/> <!-- ... --> </DxChart> </template> <script> import DxChart, { DxValueAxis // ... } from 'devextreme-vue/chart'; export default { components: { DxChart, DxValueAxis // ... } } </script>React
App.jsimport React from 'react'; import Chart, { ValueAxis // ... } from 'devextreme-react/chart'; class App extends React.Component { render() { return ( <Chart ... > <ValueAxis name="absoluteAxis"/> <ValueAxis name="percentageAxis"/> {/* ... */} </Chart> ); } } export default App;Bind series to value axes
Bind each series to a value axis using the axis property. If the axis property is missing from the series configuration, such a series will be bound to the axis declared first in the valueAxis array.jQuery
JavaScript$(function() { $("#chartContainer").dxChart({ // ... series: [{ axis: 'percentageAxis' }, { axis: 'percentageAxis' }, { // This series will be automatically bound to the 'absoluteAxis' }] }); });Angular
HTMLTypeScript<dx-chart ... > ... <dxi-chart-series axis="percentageAxis"></dxi-chart-series> <dxi-chart-series axis="percentageAxis"></dxi-chart-series> <dxi-chart-series> <!-- This series will be automatically bound to the 'absoluteAxis' --> </dxi-chart-series> </dx-chart>import { DxChartModule } from "devextreme-angular"; // ... export class AppComponent { // ... } @NgModule({ imports: [ // ... DxChartModule ], // ... })Vue
App.vue<template> <DxChart ... > <DxSeries axis="percentageAxis"/> <DxSeries axis="percentageAxis"/> <DxSeries> <!-- This series will be automatically bound to the 'absoluteAxis' --> </DxSeries> <!-- ... --> </DxChart> </template> <script> import DxChart, { DxSeries // ... } from 'devextreme-vue/chart'; export default { components: { DxChart, DxSeries // ... } } </script>React
App.jsimport React from 'react'; import Chart, { Series // ... } from 'devextreme-react/chart'; class App extends React.Component { render() { return ( <Chart ... > <Series axis="percentageAxis"/> <Series axis="percentageAxis"/> <Series> {/* This series will be automatically bound to the 'absoluteAxis' */} </Series> {/* ... */} </Chart> ); } } export default App;
All value axes in the Chart are synchronized by default, but you can explicitly specify the value at which one axis should be synchronized with others. For this purpose, set the synchronizedValue property. In addition, you can add more space between two side-by-side axes using the multipleAxesSpacing property.
jQuery
$(function() {
$("#chartContainer").dxChart({
// ...
valueAxis: [{
name: 'absoluteAxis',
synchronizedValue: 0
}, {
name: 'percentageAxis',
synchronizedValue: 0,
multipleAxesSpacing: 10
}]
});
});Angular
<dx-chart ... >
...
<dxi-chart-value-axis
name="absoluteAxis"
[synchronizedValue]="0">
</dxi-chart-value-axis>
<dxi-chart-value-axis
name="percentageAxis"
[synchronizedValue]="0"
[multipleAxesSpacing]="10">
</dxi-chart-value-axis>
</dx-chart>
import { DxChartModule } from "devextreme-angular";
// ...
export class AppComponent {
    // ...
}
@NgModule({
    imports: [
        // ...
        DxChartModule
    ],
    // ...
})
Vue
<template>
    <DxChart ... >
        <DxValueAxis
            :synchronized-value="0"
            name="absoluteAxis"
        />
        <DxValueAxis
            :synchronized-value="0"
            :multiple-axes-spacing="10"
            name="percentageAxis"
        />
    </DxChart>
</template>

<script>
import DxChart, {
    DxValueAxis
} from 'devextreme-vue/chart';

export default {
    components: {
        DxChart,
        DxValueAxis
    }
}
</script>
React
import React from 'react';
import Chart, {
    ValueAxis
} from 'devextreme-react/chart';

class App extends React.Component {
    render() {
        return (
            <Chart ... >
                <ValueAxis
                    name="absoluteAxis"
                    synchronizedValue={0}
                />
                <ValueAxis
                    name="percentageAxis"
                    synchronizedValue={0}
                    multipleAxesSpacing={10}
                />
            </Chart>
        );
    }
}

export default App;- Multi-axis charts do not support zooming and panning. If you want to change visual ranges after initialization, modify valueAxis.visualRange or argumentAxis.visualRange.
- Multi-axis charts do not support resetVisualRange().
See Also

 Select one or more answers