DevExtreme jQuery/JS - Scale Breaks
A scale break allows breaking off a part of the axis to improve the readability of a chart with high amplitude values. Scale breaks are available for continuous or logarithmic type axes only.
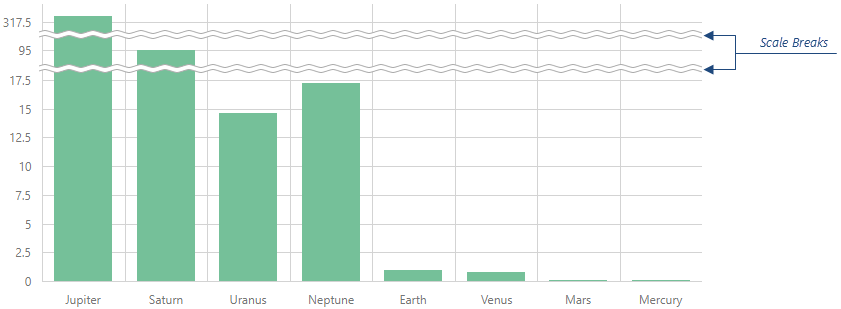
Use an axis' breaks array to declare a scale break collection. Each object in this array must have the startValue and endValue fields that limit a single scale break. Note that a scale break is visible only if the range between the start and end values exceeds the tick interval.
jQuery
JavaScript
$(function() {
    $("#chartContainer").dxChart({
        // ...
        valueAxis: { // or argumentAxis
            breaks: [
                { startValue: 100, endValue: 500 },
                { startValue: 1000, endValue: 2000 }
            ]
        }
    });
});
Angular
HTML
TypeScript
<dx-chart ... >
    <dxi-value-axis> <!-- or <dxo-argument-axis> -->
        <dxi-break [startValue]="100" [endValue]="500"></dxi-break>
        <dxi-break [startValue]="1000" [endValue]="2000"></dxi-break>
    </dxi-value-axis>
</dx-chart>
import { DxChartModule } from "devextreme-angular";
// ...
export class AppComponent {
    // ...
}
@NgModule({
    imports: [
        // ...
        DxChartModule
    ],
    // ...
})
The value axis supports auto-calculated scale breaks, which can be enabled by setting the autoBreaksEnabled option to true. You can specify the maxAutoBreakCount option to limit the number of a scale breaks the widget can generate.
jQuery
JavaScript
$(function() {
    $("#chartContainer").dxChart({
        // ...
        valueAxis: {
            autoBreaksEnabled: true,
            maxAutoBreakCount: 2
        }
    });
});
Angular
HTML
TypeScript
<dx-chart ... >
    <dxi-value-axis
        [autoBreaksEnabled]="true"
        [maxAutoBreakCount]="2">
    </dxi-value-axis>
</dx-chart>
import { DxChartModule } from "devextreme-angular";
// ...
export class AppComponent {
    // ...
}
@NgModule({
    imports: [
        // ...
        DxChartModule
    ],
    // ...
})
See Also

 Select one or more answers