JavaScript/jQuery Chart - Axis Titles
The axis title is a short text displayed alongside the axis. Usually, the axis title shows units of measurement for axis values, but you can put any text in it.
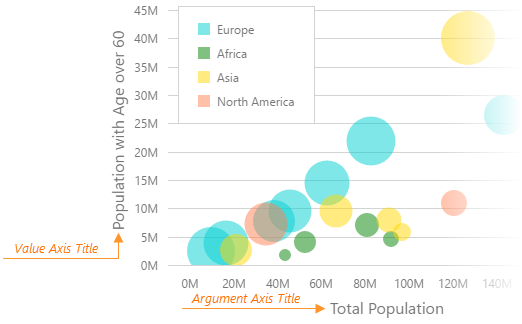
The axis title is configured by the title property. If you assign an object to it, specifying the text field of this object is necessary for the axis title to be displayed. Besides the object, the title property accepts a string, thus providing a shortcut for setting the axis title. Therefore, this:
jQuery
JavaScript
$(function() {
    $("#chartContainer").dxChart({
        // ...
        argumentAxis: { // or valueAxis
            title: 'Axis Title'
        }
    });
});
Angular
HTML
TypeScript
<dx-chart ... >
    <dxo-chart-argument-axis
        title="Axis Title">
    </dxo-chart-argument-axis>
</dx-chart>
import { DxChartModule } from "devextreme-angular";
// ...
export class AppComponent {
    // ...
}
@NgModule({
    imports: [
        // ...
        DxChartModule
    ],
    // ...
})
Vue
App.vue
<template>
    <DxChart ... >
        <DxArgumentAxis
            title="Axis Title"
        />
    </DxChart>
</template>

<script>
import DxChart, {
    DxArgumentAxis
} from 'devextreme-vue/chart';

export default {
    components: {
        DxChart,
        DxArgumentAxis
    }
}
</script>
React
App.js
import React from 'react';
import Chart, {
    ArgumentAxis
} from 'devextreme-react/chart';

class App extends React.Component {
    render() {
        return (
            <Chart ... >
                <ArgumentAxis
                    title="Axis Title"
                />
            </Chart>
        );
    }
}

export default App;
is the same as this:
jQuery
JavaScript
$(function() {
    $("#chartContainer").dxChart({
        // ...
        argumentAxis: { // or valueAxis
            title: {
                text: 'Axis Title'
            }
        }
    });
});
Angular
HTML
TypeScript
<dx-chart ... >
    <dxo-chart-argument-axis>
        <dxo-chart-title text="Axis Title"></dxo-chart-title>
    </dxo-chart-argument-axis>
</dx-chart>
import { DxChartModule } from "devextreme-angular";
// ...
export class AppComponent {
    // ...
}
@NgModule({
    imports: [
        // ...
        DxChartModule
    ],
    // ...
})
Vue
App.vue
<template>
    <DxChart ... >
        <DxArgumentAxis> <!-- or DxValueAxis -->
            <DxTitle
                text="Axis Title"
            />
        </DxArgumentAxis>
    </DxChart>
</template>

<script>
import DxChart, {
    DxArgumentAxis,
    DxTitle
} from 'devextreme-vue/chart';

export default {
    components: {
        DxChart,
        DxArgumentAxis,
        DxTitle
    }
}
</script>
React
App.js
import React from 'react';
import Chart, {
    ArgumentAxis,
    Title
} from 'devextreme-react/chart';

class App extends React.Component {
    render() {
        return (
            <Chart ... >
                <ArgumentAxis> {/* or ValueAxis */}
                    <Title
                        text="Axis Title"
                    />
                </ArgumentAxis>
            </Chart>
        );
    }
}

export default App;
In addition to the text field, the title object may contain fields that specify the font and margin of the axis title.
See Also

 Select one or more answers