JavaScript/jQuery Chart - Zooming and Panning
Zooming and panning is an efficient way to navigate a chart that contains many series points. A user can zoom and pan the chart using mouse commands or touch gestures, the scrollbar, or the RangeSelector UI component. Each of these cases are detailed in this topic.
Using Mouse Commands or Touch Gestures
Users can zoom the chart by rotating the mouse wheel and pan it using the drag gesture. On touch-enabled devices, users can zoom the chart using the spread and pinch gestures and pan the chart using the drag gesture, too.
Zooming and panning are configured in the zoomAndPan object. You can enable them separately for the argument and value axes by specifying the argumentAxis and valueAxis properties:
jQuery
$(function() {
    $("#chartContainer").dxChart({
        // ...
        zoomAndPan: {
            argumentAxis: "both",  // or "zoom" | "pan" | "none"
            valueAxis: "both"      // or "zoom" | "pan" | "none"
        }
    });
});
Angular
<dx-chart ... >
    <dxo-chart-zoom-and-pan
        argumentAxis="both"
        valueAxis="both"> <!-- or "zoom" | "pan" | "none" -->
    </dxo-chart-zoom-and-pan>
</dx-chart>
import { DxChartModule } from "devextreme-angular";
// ...
export class AppComponent {
    // ...
}
@NgModule({
    imports: [
        // ...
        DxChartModule
    ],
    // ...
})
Vue
<template>
    <DxChart ... >
        <DxZoomAndPan
            argument-axis="both"
            value-axis="both"
        /> <!-- or "zoom" | "pan" | "none" -->
    </DxChart>
</template>

<script>
import DxChart, {
    DxZoomAndPan
} from 'devextreme-vue/chart';

export default {
    components: {
        DxChart,
        DxZoomAndPan
    }
}
</script>
React
import React from 'react';
import Chart, {
    ZoomAndPan
} from 'devextreme-react/chart';

class App extends React.Component {
    render() {
        return (
            <Chart ... >
                <ZoomAndPan
                    argumentAxis="both"
                    valueAxis="both"
                /> {/* or "zoom" | "pan" | "none" */}
            </Chart>
        );
    }
}

export default App;Users can zoom the chart using the drag gesture (area selection) if you enable the dragToZoom property. To pan in this case, users should perform the drag gesture while pressing panKey. Zooming and panning should be enabled.
jQuery
$(function() {
    $("#chartContainer").dxChart({
        // ...
        zoomAndPan: {
            dragToZoom: true,
            panKey: "ctrl",
            argumentAxis: "both",
            valueAxis: "both"
        }
    });
});
Angular
<dx-chart ... >
    <dxo-chart-zoom-and-pan
        [dragToZoom]="true"
        panKey="ctrl"
        argumentAxis="both"
        valueAxis="both">
    </dxo-chart-zoom-and-pan>
</dx-chart>
import { DxChartModule } from "devextreme-angular";
// ...
export class AppComponent {
    // ...
}
@NgModule({
    imports: [
        // ...
        DxChartModule
    ],
    // ...
})
Vue
<template>
    <DxChart ... >
        <DxZoomAndPan
            :drag-to-zoom="true"
            pan-key="ctrl"
            argument-axis="both"
            value-axis="both"
        />
    </DxChart>
</template>

<script>
import DxChart, {
    DxZoomAndPan
} from 'devextreme-vue/chart';

export default {
    components: {
        DxChart,
        DxZoomAndPan
    }
}
</script>
React
import React from 'react';
import Chart, {
    ZoomAndPan
} from 'devextreme-react/chart';

class App extends React.Component {
    render() {
        return (
            <Chart ... >
                <ZoomAndPan
                    dragToZoom={true}
                    panKey="ctrl"
                    argumentAxis="both"
                    valueAxis="both"
                />
            </Chart>
        );
    }
}

export default App;
If you need to disable the mouse wheel or touch support, set the allowMouseWheel or allowTouchGestures property to false. In the following example, zooming and panning are enabled only on devices that use the mouse.
jQuery
$(function() {
    $("#chartContainer").dxChart({
        // ...
        zoomAndPan: {
            argumentAxis: "both",
            valueAxis: "both",
            allowTouchGestures: false
        }
    });
});
Angular
<dx-chart ... >
    <dxo-chart-zoom-and-pan
        argumentAxis="both"
        valueAxis="both"
        [allowTouchGestures]="false">
    </dxo-chart-zoom-and-pan>
</dx-chart>
import { DxChartModule } from "devextreme-angular";
// ...
export class AppComponent {
    // ...
}
@NgModule({
    imports: [
        // ...
        DxChartModule
    ],
    // ...
})
Vue
<template>
    <DxChart ... >
        <DxZoomAndPan
            :allow-touch-gestures="false"
            argument-axis="both"
            value-axis="both"
        />
    </DxChart>
</template>

<script>
import DxChart, {
    DxZoomAndPan
} from 'devextreme-vue/chart';

export default {
    components: {
        DxChart,
        DxZoomAndPan
    }
}
</script>
React
import React from 'react';
import Chart, {
    ZoomAndPan
} from 'devextreme-react/chart';

class App extends React.Component {
    render() {
        return (
            <Chart ... >
                <ZoomAndPan
                    allowTouchGestures={false}
                    argumentAxis="both"
                    valueAxis="both"
                />
            </Chart>
        );
    }
}

export default App;
Users cannot zoom or scroll the chart out of the whole range. Refer to the Visual and Whole Ranges article for more information.
See Also
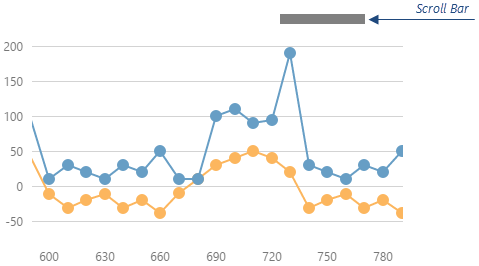
Using the Scroll Bar
The scrollbar is a chart element used for panning.
You can configure the scrollbar using the scrollBar object. To display the scrollbar, set this object's visible property to true after enabling zooming and panning.
jQuery
$(function() {
    $("#chartContainer").dxChart({
        // ...
        zoomAndPan: {
            argumentAxis: "both",
            valueAxis: "both"
        },
        scrollBar: {
            visible: true,
            //...
        }
    });
});
Angular
<dx-chart ... >
    <dxo-chart-zoom-and-pan
        argumentAxis="both"
        valueAxis="both">
    </dxo-chart-zoom-and-pan>
    <dxo-chart-scroll-bar [visible]="true" ... ></dxo-chart-scroll-bar>
</dx-chart>
import { DxChartModule } from "devextreme-angular";
// ...
export class AppComponent {
    // ...
}
@NgModule({
    imports: [
        // ...
        DxChartModule
    ],
    // ...
})
Vue
<template>
    <DxChart ... >
        <DxZoomAndPan
            argument-axis="both"
            value-axis="both"
        />
        <DxScrollBar ...
            :visible="true"
        />
    </DxChart>
</template>

<script>
import DxChart, {
    DxZoomAndPan,
    DxScrollBar
} from 'devextreme-vue/chart';

export default {
    components: {
        DxChart,
        DxZoomAndPan,
        DxScrollBar
    }
}
</script>
React
import React from 'react';
import Chart, {
    ZoomAndPan,
    ScrollBar
} from 'devextreme-react/chart';

class App extends React.Component {
    render() {
        return (
            <Chart ... >
                <ZoomAndPan
                    argumentAxis="both"
                    valueAxis="both"
                />
                <ScrollBar ...
                    visible={true}
                />
            </Chart>
        );
    }
}

export default App;Users cannot zoom or scroll the chart out of the whole range. Refer to the Visual and Whole Ranges article for more information.
See Also
Using the RangeSelector Component
The Chart can be zoomed and panned using the RangeSelector UI component. The following code shows how to bind these UI components. Note that the Chart and RangeSelector have a common data source and may have the same series configuration if the RangeSelector should display the Chart in the background.
jQuery
$(function() {
    // Common data source for both UI components
    var data = [ ... ];
    // Common series configuration for both UI components
    var seriesConfiguration = [ ... ];

    var chart = $("#chartContainer").dxChart({
        dataSource: data,
        series: seriesConfiguration
    }).dxChart("instance");

    $("#rangeSelectorContainer").dxRangeSelector({
        dataSource: data,
        // Displays the Chart in the background of the RangeSelector
        chart: {
            series: seriesConfiguration
        },
        onValueChanged: function (e) {
            // Zooms the Chart
            chart.getArgumentAxis().visualRange(e.value);
        },
        // Makes zooming and panning smoother
        behavior: { callValueChanged: "onMoving" }
    });
});
Angular
<dx-chart
    [dataSource]="data"
    [series]="seriesConfiguration">
    <dxo-chart-argument-axis
        [(visualRange)]="chart_visualRange">
    </dxo-chart-argument-axis>
</dx-chart>
<dx-range-selector
    [dataSource]="data"
    [(value)]="chart_visualRange">
    <!-- Displays the Chart in the background of the RangeSelector -->
    <dxo-range-selector-chart [series]="seriesConfiguration"></dxo-range-selector-chart>
    <!-- Makes zooming and panning smoother -->
    <dxo-range-selector-behavior callValueChanged="onMoving"></dxo-range-selector-behavior>
</dx-range-selector>
import { DxChartModule, DxRangeSelectorModule } from "devextreme-angular";
// ...
export class AppComponent {
    chart_visualRange = [ ... ];
    // Common data source for both UI components
    data = [ ... ];
    // Common series configuration for both UI components
    seriesConfiguration = [ ... ];
}
@NgModule({
    imports: [
        // ...
        DxChartModule,
        DxRangeSelectorModule
    ],
    // ...
})
Vue
<template>
    <DxChart
        :data-source="data"
        :series="seriesConfiguration">
        <DxArgumentAxis :visual-range="chart_visualRange"/>
    </DxChart>
    <DxRangeSelector
        :data-source="data"
        v-model:value="chart_visualRange">
        <!-- Displays the Chart in the background of the RangeSelector -->
        <DxRsChart :series="seriesConfiguration"/>
        <!-- Makes zooming and panning smoother -->
        <DxBehavior call-value-changed="onMoving"/>
    </DxRangeSelector>
</template>

<script>
import DxChart, {
    DxArgumentAxis
} from 'devextreme-vue/chart';
import DxRangeSelector, {
    DxChart as DxRsChart,
    DxBehavior
} from 'devextreme-vue/range-selector';

export default {
    components: {
        DxChart,
        DxArgumentAxis,
        DxRangeSelector,
        DxRsChart,
        DxBehavior
    },
    data() {
        return {
            chart_visualRange: [ ... ],
            // Common data source for both UI components
            data: [ ... ],
            // Common series configuration for both UI components
            seriesConfiguration: [ ... ]
        };
    }
}
</script>
React
import React from 'react';
import Chart, {
    ArgumentAxis
} from 'devextreme-react/chart';
import RangeSelector, {
    Chart as RsChart,
    Behavior
} from 'devextreme-react/range-selector';

// Common data source for both UI components
const data = [ ... ];
// Common series configuration for both UI components
const seriesConfiguration = [ ... ];

class App extends React.Component {
    constructor(props) {
        super(props);
        this.state = { chart_visualRange: [ ... ] };
        this.updateChartVisualRange = () => this.setState({ chart_visualRange: e.value });
    }

    render() {
        return (
            <Chart
                dataSource={data}
                series={seriesConfiguration}>
                <ArgumentAxis visualRange={this.state.chart_visualRange} />
            </Chart>
            <RangeSelector
                dataSource={data}
                onValueChanged={this.updateChartVisualRange}>
                {/* Displays the Chart in the background of the RangeSelector */}
                <RsChart series={seriesConfiguration} />
                {/* Makes zooming and panning smoother */}
                <Behavior callValueChanged="onMoving" />
            </RangeSelector>
        );
    }
}

export default App;When your data source is updated in real time, the behavior of both the Chart's visual range and the RangeSelector's selected range depends on the selectedRangeUpdateMode property specified for the RangeSelector:
jQuery
$(function() {
    // ...
    // The Chart is configured here

    $("#rangeSelectorContainer").dxRangeSelector({
        // ...
        selectedRangeUpdateMode: "keep" // the ranges remain unchanged
    });
});
Angular
<dx-chart ... ></dx-chart>
<dx-range-selector ...
    selectedRangeUpdateMode="keep"> <!-- the ranges remain unchanged -->
</dx-range-selector>
import { DxChartModule, DxRangeSelectorModule } from "devextreme-angular";
// ...
export class AppComponent {
    // ...
}
@NgModule({
    imports: [
        // ...
        DxChartModule,
        DxRangeSelectorModule
    ],
    // ...
})
Vue
<template>
    <DxChart ... >
    </DxChart>
    <DxRangeSelector ...
        selected-range-update-mode="keep"> <!-- the ranges remain unchanged -->
    </DxRangeSelector>
</template>

<script>
import DxChart from 'devextreme-vue/chart';
import DxRangeSelector from 'devextreme-vue/range-selector';

export default {
    components: {
        DxChart,
        DxRangeSelector
    }
}
</script>
React
import React from 'react';
import Chart from 'devextreme-react/chart';
import RangeSelector from 'devextreme-react/range-selector';

class App extends React.Component {
    render() {
        return (
            <Chart ... >
            </Chart>
            <RangeSelector ...
                selectedRangeUpdateMode="keep"> {/* the ranges remain unchanged */}
            </RangeSelector>
        );
    }
}

export default App;
If you need to fix the zoom window and allow users to only move it along the scale, set the scale object's minRange and maxRange properties to a single value defining the zoom window's length. Make sure you specify the initial zoom factor using the value property.
jQuery
$(function() {
    // ...
    // The Chart is configured here

    $("#rangeSelectorContainer").dxRangeSelector({
        // ...
        scale: {
            minRange: 10,
            maxRange: 10
        },
        value: [0, 10]
    });
});
Angular
<dx-chart ... ></dx-chart>
<dx-range-selector ...
    [value]="[0, 10]">
    <dxo-range-selector-scale [minRange]="10" [maxRange]="10"></dxo-range-selector-scale>
</dx-range-selector>
import { DxChartModule, DxRangeSelectorModule } from "devextreme-angular";
// ...
export class AppComponent {
    // ...
}
@NgModule({
    imports: [
        // ...
        DxChartModule,
        DxRangeSelectorModule
    ],
    // ...
})
Vue
<template>
    <DxChart ... >
    </DxChart>
    <DxRangeSelector ...
        v-model="range">
        <DxScale
            :min-range="10"
            :max-range="10"
        />
    </DxRangeSelector>
</template>

<script>
import DxChart from 'devextreme-vue/chart';
import DxRangeSelector, {
    DxScale
} from 'devextreme-vue/range-selector';

export default {
    components: {
        DxChart,
        DxRangeSelector,
        DxScale
    },
    data() {
        return {
            range: [0, 10]
        };
    }
}
</script>
React
import React from 'react';
import Chart from 'devextreme-react/chart';
import RangeSelector, {
    Scale
} from 'devextreme-react/range-selector';

class App extends React.Component {
    render() {
        return (
            <Chart ... >
            </Chart>
            <RangeSelector ...
                defaultValue={[0, 10]}>
                <Scale
                    minRange={10}
                    maxRange={10}
                />
            </RangeSelector>
        );
    }
}

export default App;
See Also
Set the Initial Zoom
To zoom a standalone Chart initially, specify the axis' visualRange.
jQuery
$(function() {
    $("#chartContainer").dxChart({
        argumentAxis: {
            visualRange: [0, 10]
        }
    });
});
Angular
<dx-chart ... >
    <dxo-chart-argument-axis
        [visualRange]="[0, 10]">
    </dxo-chart-argument-axis>
</dx-chart>
import { DxChartModule } from "devextreme-angular";
// ...
export class AppComponent {
    // ...
}
@NgModule({
    imports: [
        // ...
        DxChartModule
    ],
    // ...
})
Vue
<template>
    <DxChart ... >
        <DxArgumentAxis :visual-range="chart_visualRange"/>
    </DxChart>
</template>

<script>
import DxChart, {
    DxArgumentAxis
} from 'devextreme-vue/chart';

export default {
    components: {
        DxChart,
        DxArgumentAxis
    },
    data() {
        return {
            chart_visualRange: [0, 10]
        };
    }
}
</script>
React
import React from 'react';
import Chart, {
    ArgumentAxis
} from 'devextreme-react/chart';

const chart_visualRange = [0, 10];

class App extends React.Component {
    render() {
        return (
            <Chart ... >
                <ArgumentAxis visualRange={chart_visualRange} />
            </Chart>
        );
    }
}

export default App;
For more information about visual and whole ranges, refer to the following article: Visual and Whole Ranges.
If the Chart is bound to the RangeSelector, specify the Chart's initial zoom factor by setting the RangeSelector's value property.
jQuery
$(function() {
    // ...
    // The Chart is configured here

    $("#rangeSelectorContainer").dxRangeSelector({
        // ...
        value: [0, 10]
    });
});
Angular
<dx-chart ... >
    <dxo-chart-argument-axis
        [(visualRange)]="chart_visualRange">
    </dxo-chart-argument-axis>
</dx-chart>
<dx-range-selector ...
    [(value)]="chart_visualRange">
</dx-range-selector>
import { DxChartModule, DxRangeSelectorModule } from "devextreme-angular";
// ...
export class AppComponent {
    // ...
    chart_visualRange = [0, 10];
}
@NgModule({
    imports: [
        // ...
        DxChartModule,
        DxRangeSelectorModule
    ],
    // ...
})
Vue
<template>
    <DxChart ... >
        <DxArgumentAxis :visual-range="chart_visualRange"/>
    </DxChart>
    <DxRangeSelector ...
        v-model:value="chart_visualRange">
    </DxRangeSelector>
</template>

<script>
import DxChart, {
    DxArgumentAxis
} from 'devextreme-vue/chart';
import DxRangeSelector from 'devextreme-vue/range-selector';

export default {
    components: {
        DxChart,
        DxArgumentAxis,
        DxRangeSelector
    },
    data() {
        return {
            chart_visualRange: [0, 10]
        };
    }
}
</script>
React
import React from 'react';
import Chart, {
    ArgumentAxis
} from 'devextreme-react/chart';
import RangeSelector from 'devextreme-react/range-selector';

class App extends React.Component {
    constructor(props) {
        super(props);
        this.state = { chart_visualRange: [0, 10] };
        this.updateChartVisualRange = () => this.setState({ chart_visualRange: e.value });
    }

    render() {
        return (
            <Chart ... >
                <ArgumentAxis visualRange={this.state.chart_visualRange} />
            </Chart>
            <RangeSelector ...
                onValueChanged={this.updateChartVisualRange}>
            </RangeSelector>
        );
    }
}

export default App;Stop Zooming or Panning
The Chart provides the onZoomEnd event handler that can be used to stop zooming or panning when a specific condition is met.
For example, you can disallow users to zoom in further if the visual range's length is less than 1:
jQuery
$(function() {
    $("#chartContainer").dxChart({
        // ...
        onZoomEnd: function(e) {
            e.cancel = (e.range.endValue - e.range.startValue) < 1;
        },
        zoomAndPan: {
            argumentAxis: "both",
            valueAxis: "both"
        }
    });
});
Angular
<dx-chart ...
    (onZoomEnd)="chart_zoomEnd($event)">
    <dxo-chart-zoom-and-pan
        argumentAxis="both"
        valueAxis="both">
    </dxo-chart-zoom-and-pan>
</dx-chart>
import { DxChartModule } from "devextreme-angular";
// ...
export class AppComponent {
    chart_zoomEnd(e) {
        e.cancel = (e.range.endValue - e.range.startValue) < 1;
    }
}
@NgModule({
    imports: [
        // ...
        DxChartModule
    ],
    // ...
})
Vue
<template>
    <DxChart ...
        @zoom-end="chart_zoomEnd">
        <DxZoomAndPan
            argument-axis="both"
            value-axis="both"
        />
    </DxChart>
</template>

<script>
import DxChart, {
    DxZoomAndPan
} from 'devextreme-vue/chart';

export default {
    components: {
        DxChart,
        DxZoomAndPan
    },
    methods: {
        chart_zoomEnd(e) {
            e.cancel = (e.range.endValue - e.range.startValue) < 1;
        }
    }
}
</script>
React
import React from 'react';
import Chart, {
    ZoomAndPan
} from 'devextreme-react/chart';

class App extends React.Component {
    render() {
        return (
            <Chart ...
                onZoomEnd={chart_zoomEnd}>
                <ZoomAndPan
                    argumentAxis="both"
                    valueAxis="both"
                />
            </Chart>
        );
    }
}

functon chart_zoomEnd(e) {
    e.cancel = (e.range.endValue - e.range.startValue) < 1;
}

export default App;
 Select one or more answers