Angular Chart - commonAxisSettings.grid
Configures the grid.
Selector: dxo-grid
Type:
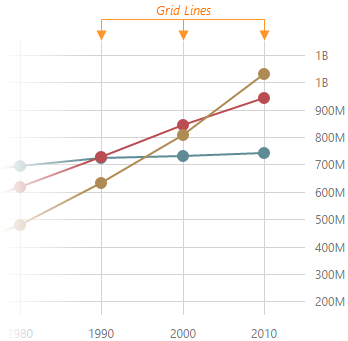
Gridlines can be considered extensions of ticks.
jQuery
index.js
$('#chart').dxChart({
    commonAxisSettings: {
        grid: {
            visible: true,
            color: 'blue',
            opacity: 0.25,
            width: 2,
        },
    },
})
Angular
app.component.html
<dx-chart ... >
    <dxo-chart-common-axis-settings>
        <dxo-chart-grid
            [visible]="true"
            color="blue"
            [opacity]="0.25"
            [width]="2"
        ></dxo-chart-grid>
    </dxo-chart-common-axis-settings>
</dx-chart>
Vue
App.vue
<template>
    <DxChart ... >
        <DxCommonAxisSettings>
            <DxGrid
                :visible="true"
                color="blue"
                :opacity="0.25"
                :width="2"
            />
        </DxCommonAxisSettings>
    </DxChart>
</template>

<script setup lang="ts">
import { DxChart, DxCommonAxisSettings, DxGrid } from 'devextreme-vue/chart';

</script>
React
App.tsx
import { Chart, CommonAxisSettings, Grid } from 'devextreme-react/chart';

function App() {
    return (
        <Chart ... >
            <CommonAxisSettings>
                <Grid
                    visible={true}
                    color="blue"
                    opacity={0.25}
                    width={2}
                />
            </CommonAxisSettings>
        </Chart>
    )
}
The commonAxisSettings.grid object specifies common settings for all gridlines on a chart. To configure only those grid lines that descend from a particular axis, use the following objects:
Axis-specific settings override common settings.
See Also
- commonAxisSettings.minorGrid - configures the minor grid built on minor ticks.
color
Specifies the color of grid lines.
Type:
Default Value: '#d3d3d3'
This property supports the following colors:
- Hexadecimal colors
- RGB colors
- RGBA colors
- Predefined/cross-browser color names
- Predefined SVG colors
- Paint server address

 Select one or more answers