React DataGrid - Choose a Data Management Component
DevExtreme includes four main components for data display and management:
Each component connects to similar data sources. Selecting the relevant component depends on the structure of your data and your requirements.
DataGrid
Displays tabular data and enables editing. Features include filtering, sorting, grouping, and multiple editing modes. For the expanded list of features, refer to the DataGrid Key Features help topic.
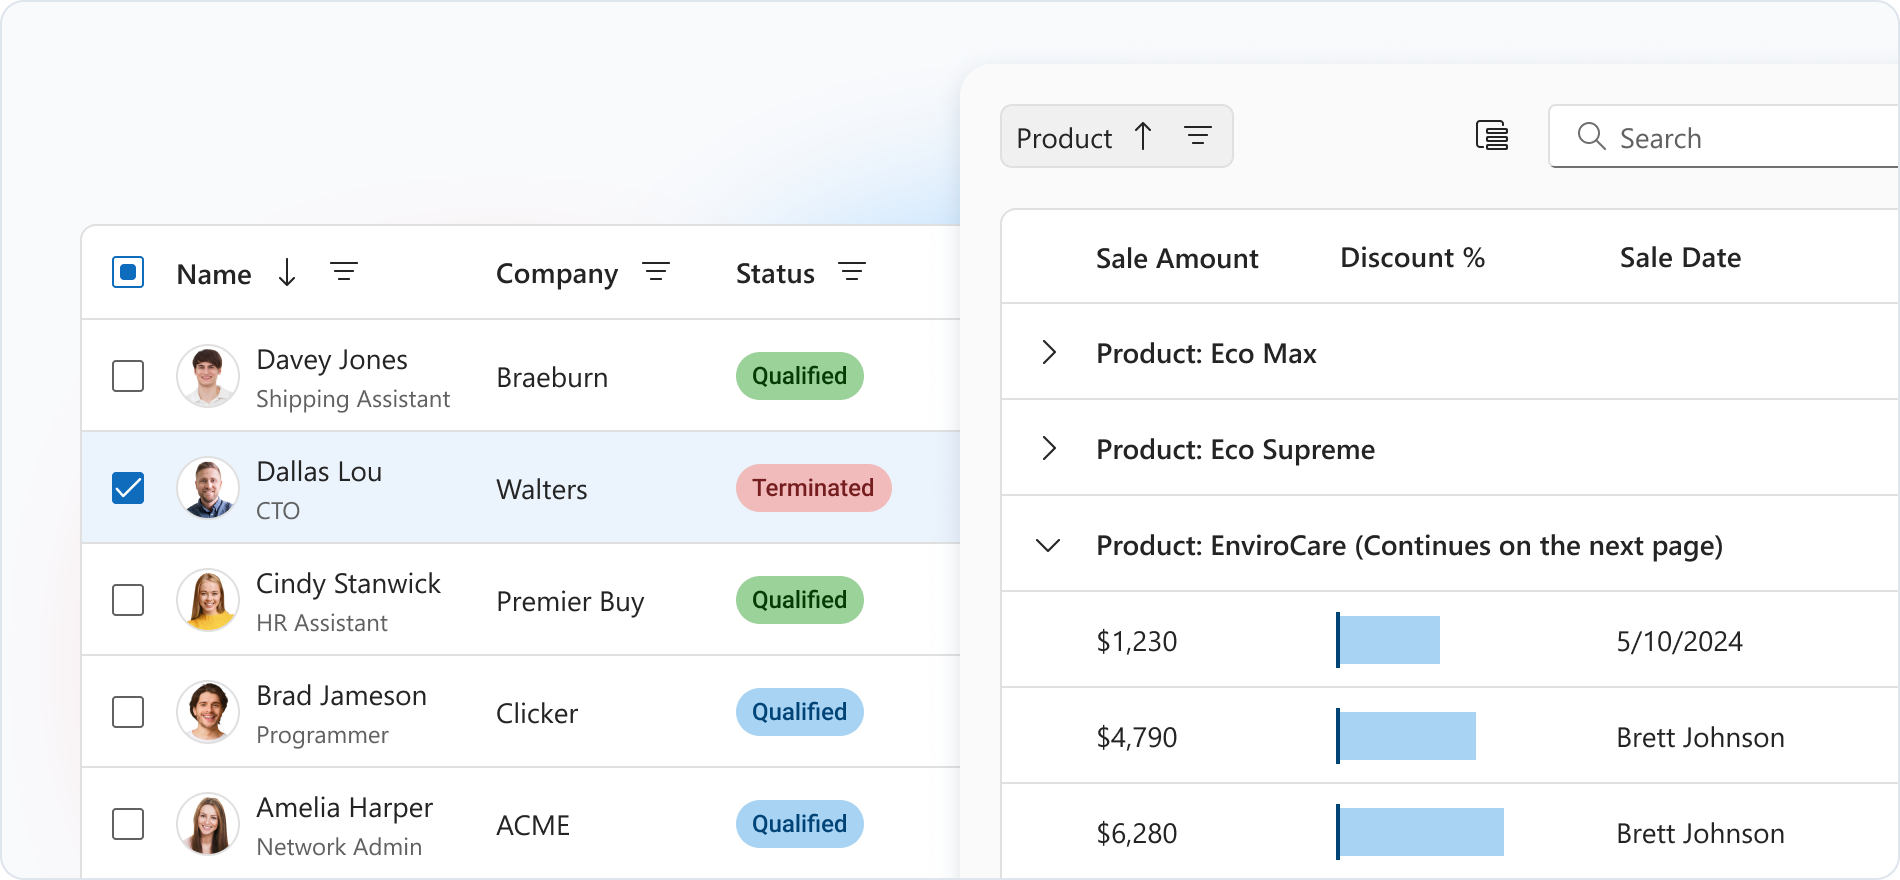
Typical Usage Scenarios
- Detailed item lists: orders, customers, transactions
- Tables with multiple editing options, including real-time updates
- Large catalogs with varied data
TreeList
Displays hierarchical data in a tree with grid-like features. Suitable for parent-child structures. For an expanded list of features, see TreeList Key Features.
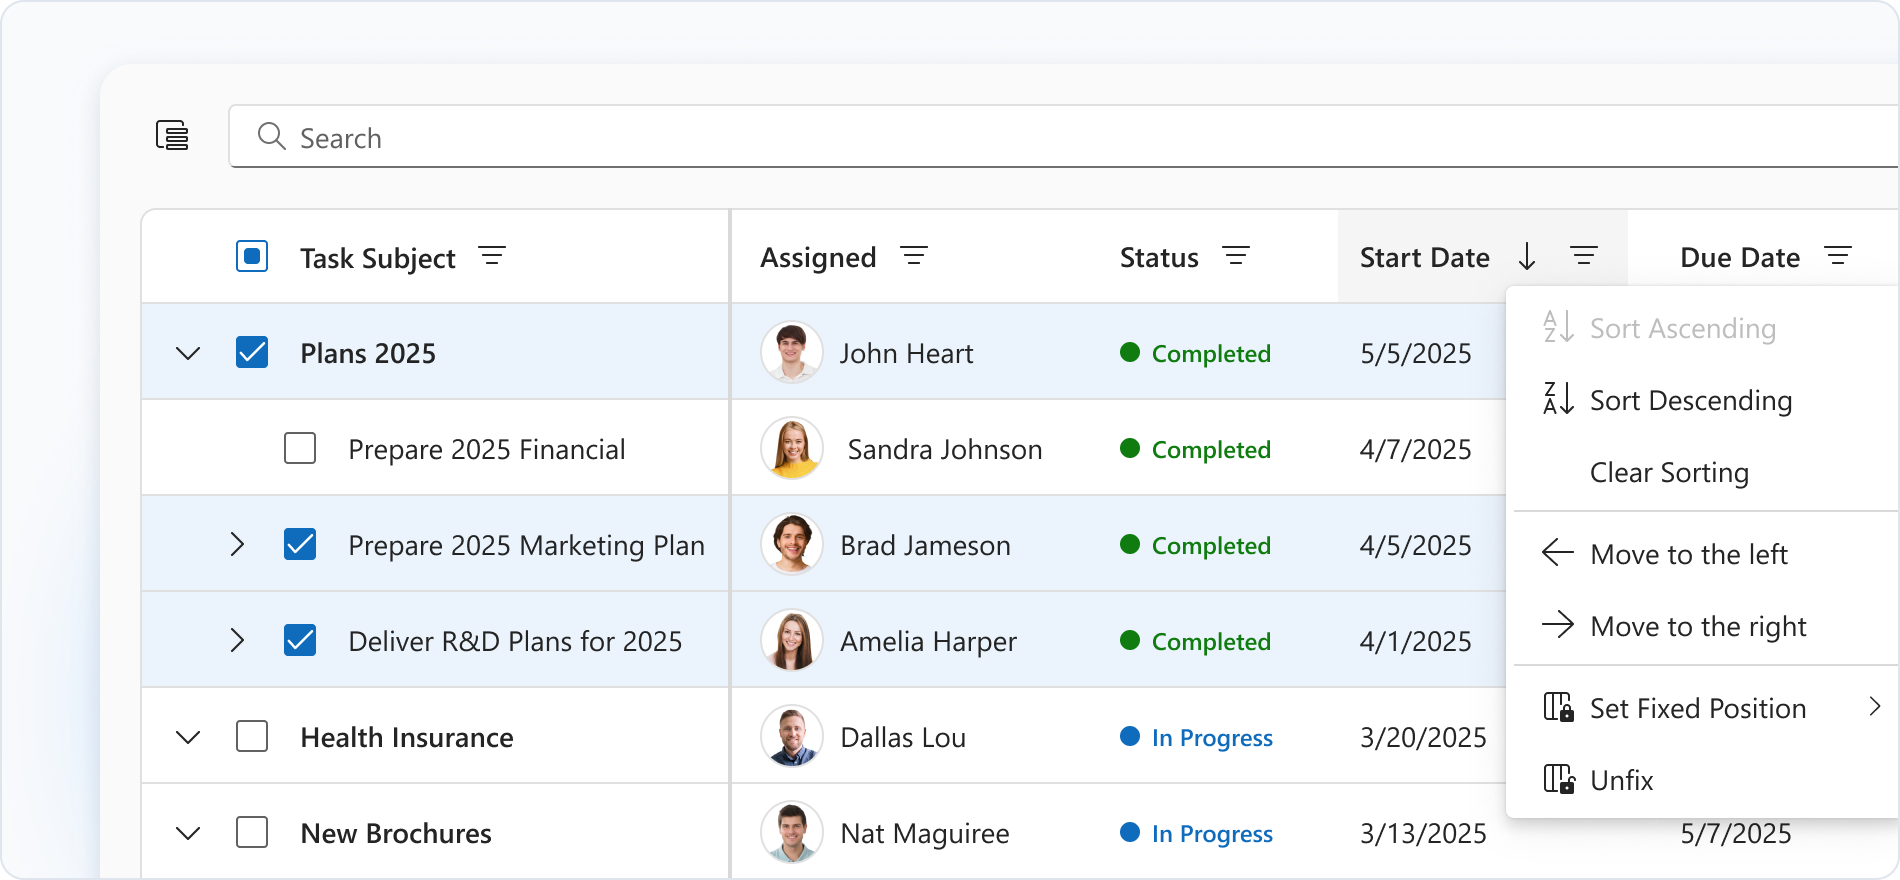
Typical Usage Scenarios
- Organizational structures: Customer Relationship Management (CRM) and Human Resource Management (HRM)
- Category hierarchies (for example, project tasks)
- File structures
PivotGrid
Displays and analyzes multidimensional data. Used for OLAP reporting and analytics. Supports custom aggregation. For an expanded list of features, see PivotGrid Key Features.
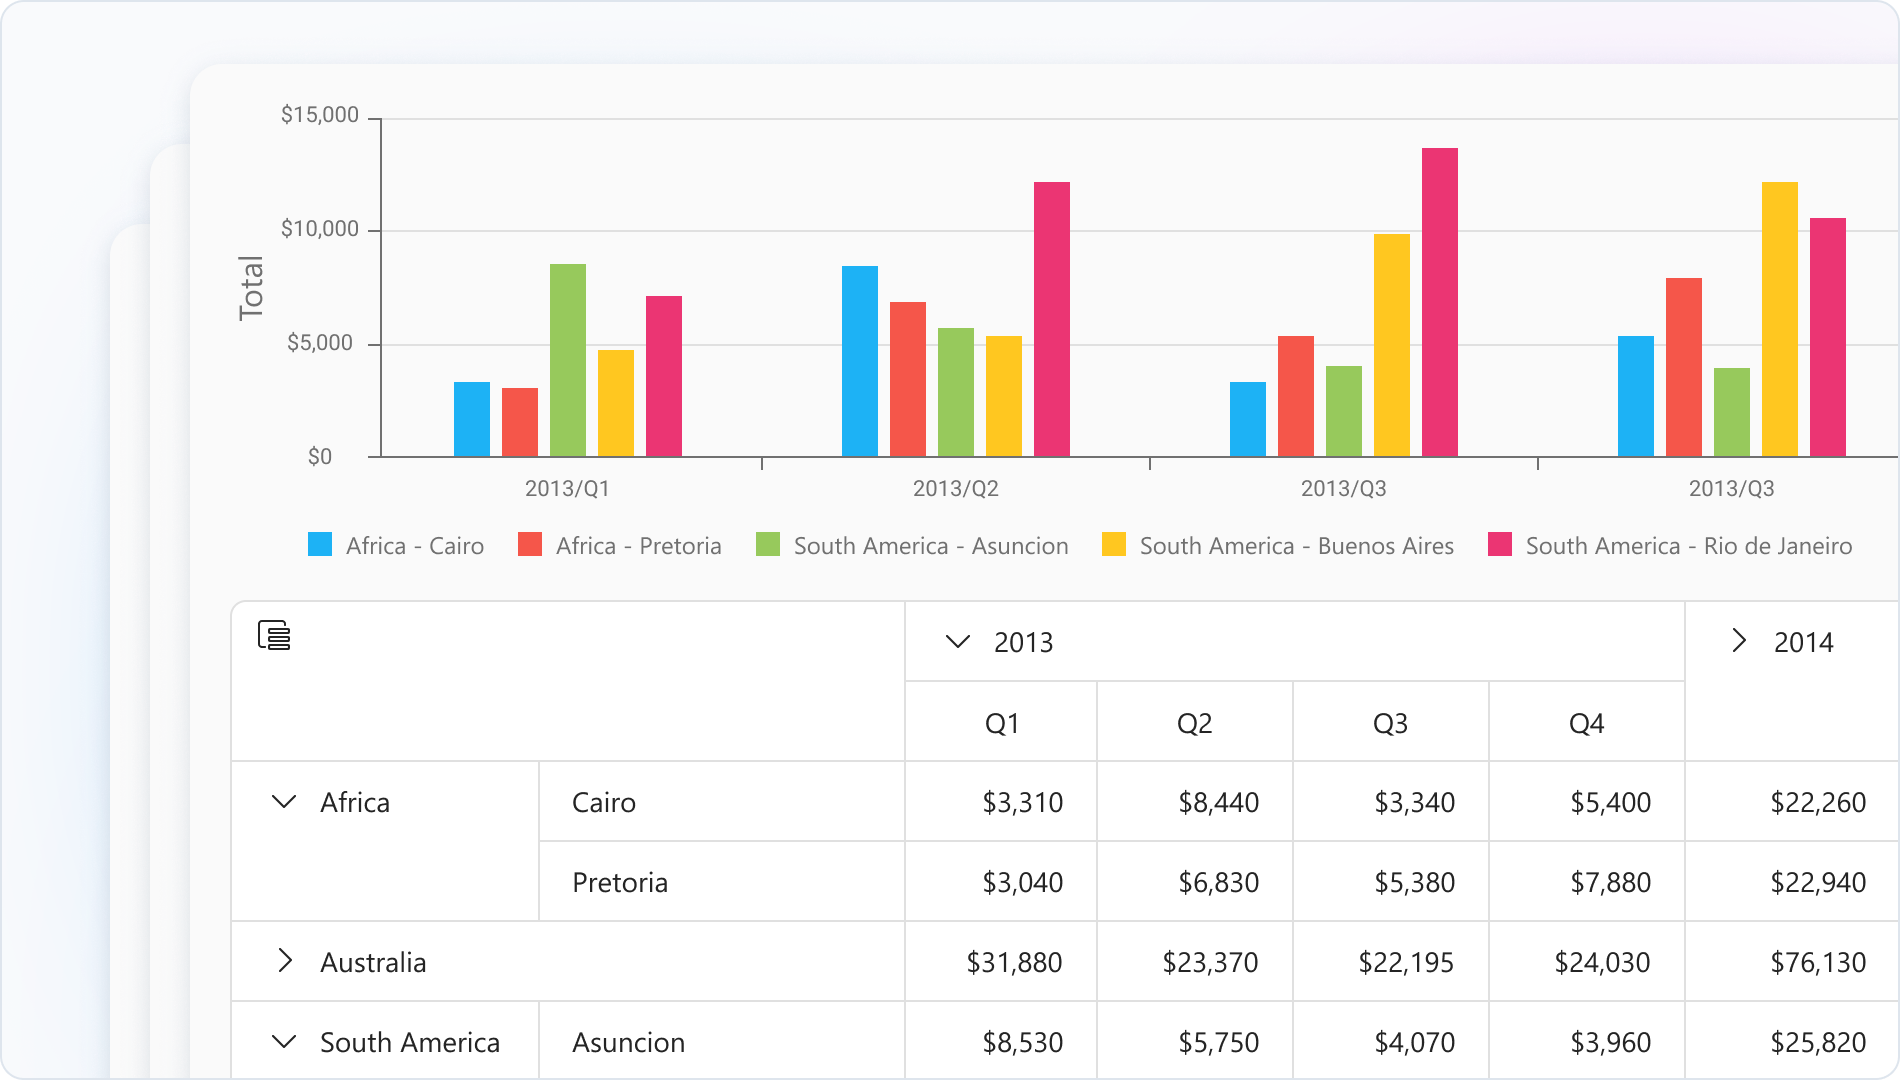
Typical Usage Scenarios
- Sales analysis by region, period, or product
- Comparison of financial metrics
- Presenting information in tabular form and as charts
CardView
Displays data records as cards. Ideal for visual layouts, adaptive interfaces, and scenarios focused on presentation. For an expanded list of features, see CardView Key Features.
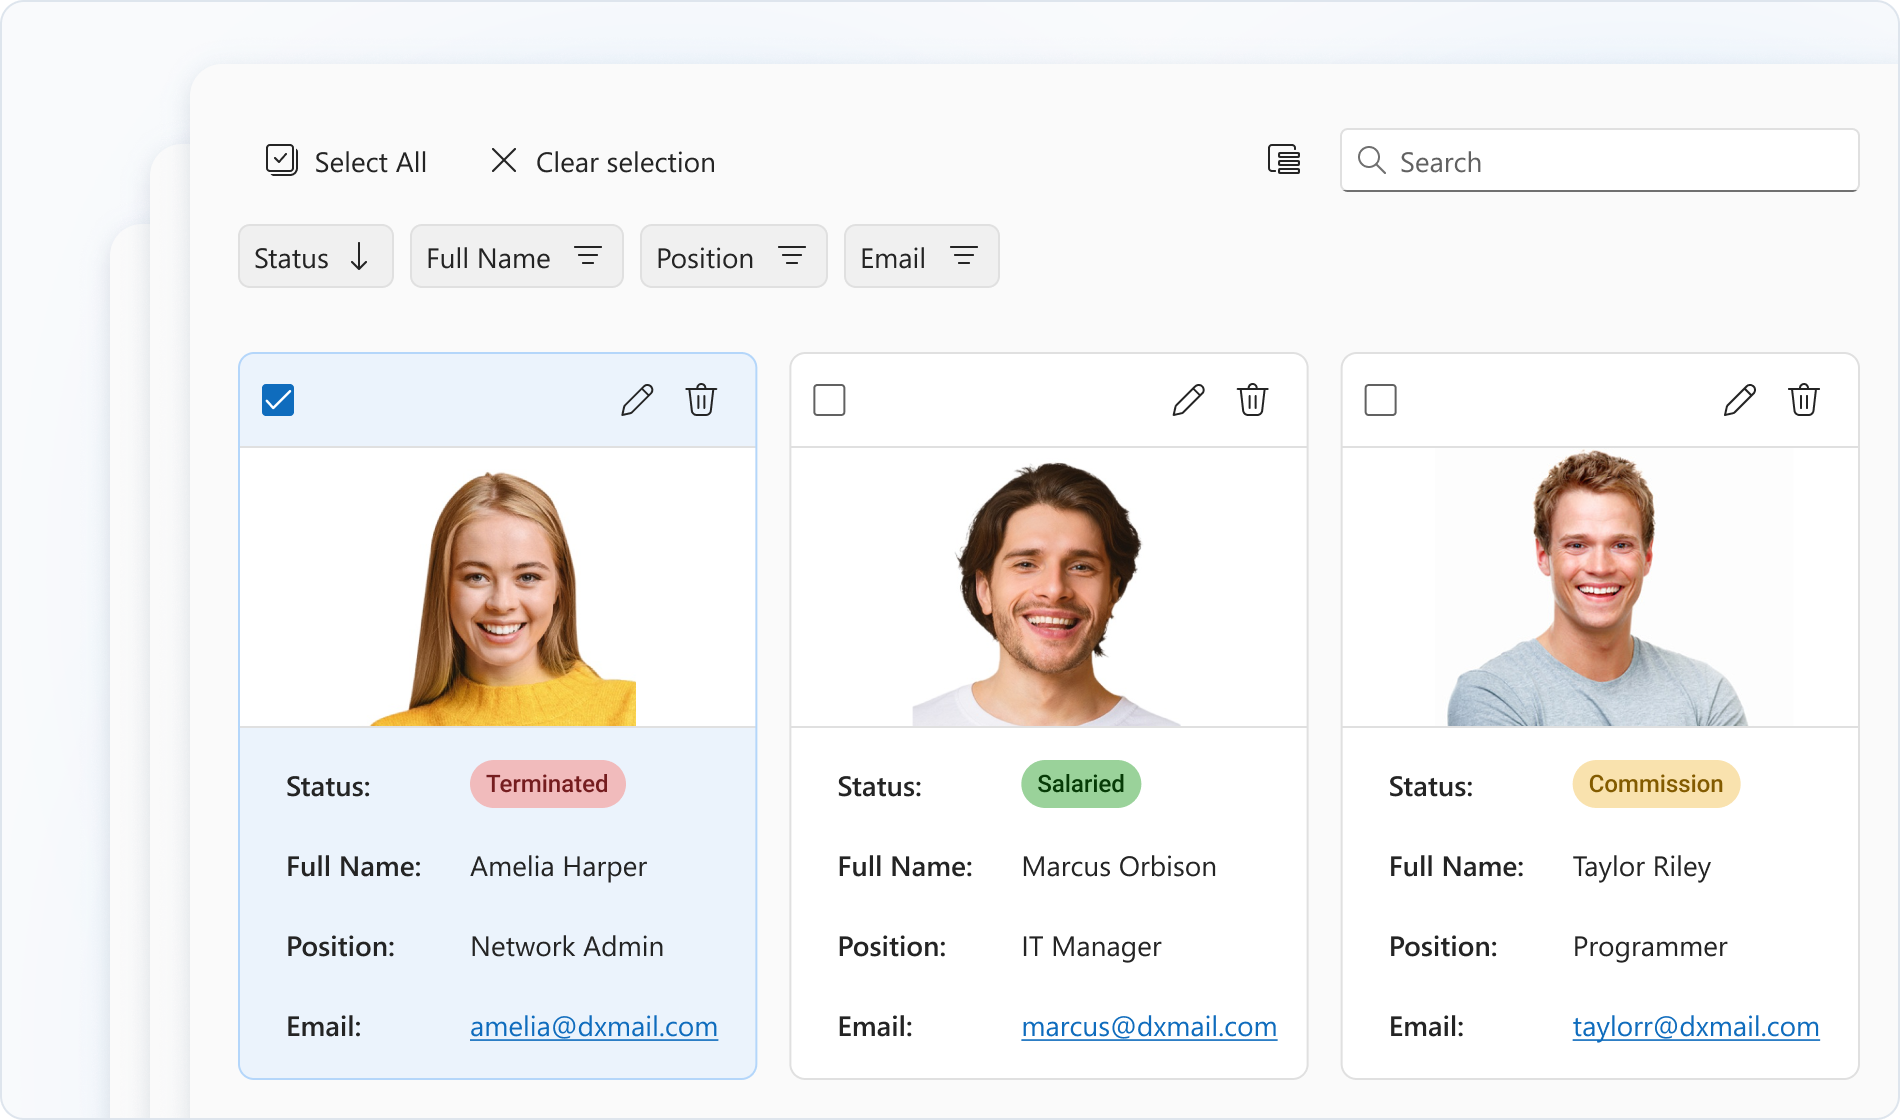
Typical Usage Scenarios
- Product directories with images
- Employee or customer lists
- Kanban-style boards for projects or tasks

 Select one or more answers