Vue Chart - Limit and Relocate the Axes
The visual range of arguments/values on an axis should include all arguments/values of all series. If you want to reduce the visual range, specify the axis's visualRange property.
jQuery
JavaScript
$(function() {
    $("#chartContainer").dxChart({
        // ...
        argumentAxis: { // or valueAxis
            visualRange: [1950, 2000]
        }
    });
});
Angular
HTML
TypeScript
<dx-chart ... >
    <dxo-chart-argument-axis
        [visualRange]="[1950, 2000]">
    </dxo-chart-argument-axis>
</dx-chart>
import { DxChartModule } from "devextreme-angular";
// ...
export class AppComponent {
    // ...
}
@NgModule({
    imports: [
        // ...
        DxChartModule
    ],
    // ...
})
Vue
App.vue
<template>
    <DxChart ... >
        <DxArgumentAxis
            :visual-range="[1950, 2000]"
        />
    </DxChart>
</template>

<script>
import DxChart, {
    DxArgumentAxis
} from 'devextreme-vue/chart';

export default {
    components: {
        DxChart,
        DxArgumentAxis
    }
}
</script>
React
App.js
import React from 'react';
import Chart, {
    ArgumentAxis
} from 'devextreme-react/chart';

class App extends React.Component {
    visualRange = [1950, 2000];

    render() {
        return (
            <Chart ... >
                <ArgumentAxis
                    defaultVisualRange={this.visualRange}
                />
            </Chart>
        );
    }
}

export default App;
Axes can be relocated to their opposite side using the position property. Note that available positions for each axis depend on whether the chart is rotated or not.
jQuery
JavaScript
$(function() {
    $("#chartContainer").dxChart({
        // ...
        argumentAxis: {
            position: 'top'
        },
        valueAxis: {
            position: 'right'
        }
    });
});
Angular
HTML
TypeScript
<dx-chart ... >
    <dxo-chart-argument-axis
        position="top">
    </dxo-chart-argument-axis>
    <dxi-chart-value-axis
        position="right">
    </dxi-chart-value-axis>
</dx-chart>
import { DxChartModule } from "devextreme-angular";
// ...
export class AppComponent {
    // ...
}
@NgModule({
    imports: [
        // ...
        DxChartModule
    ],
    // ...
})
Vue
App.vue
<template>
    <DxChart ... >
        <DxArgumentAxis position="top"/>
        <DxValueAxis position="right"/>
    </DxChart>
</template>

<script>
import DxChart, {
    DxArgumentAxis,
    DxValueAxis
} from 'devextreme-vue/chart';

export default {
    components: {
        DxChart,
        DxArgumentAxis,
        DxValueAxis
    }
}
</script>
React
App.js
import React from 'react';
import Chart, {
    ArgumentAxis,
    ValueAxis
} from 'devextreme-react/chart';

class App extends React.Component {
    render() {
        return (
            <Chart ... >
                <ArgumentAxis position="top" />
                <ValueAxis position="right" />
            </Chart>
        );
    }
}

export default App;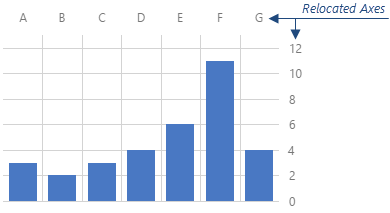
See Also

 Select one or more answers